HOT TOPICS LIST
- MACD
- Fibonacci
- RSI
- Gann
- ADXR
- Stochastics
- Volume
- Triangles
- Futures
- Cycles
- Volatility
- ZIGZAG
- MESA
- Retracement
- Aroon
INDICATORS LIST
LIST OF TOPICS
PRINT THIS ARTICLE
by David Penn
Bouncing off support from a years-long trend channel, crude oil's short-term weakness could be a prelude to longer-term strength.
Position: N/A
David Penn
Technical Writer for Technical Analysis of STOCKS & COMMODITIES magazine, Working-Money.com, and Traders.com Advantage.
PRINT THIS ARTICLE
CHANNEL LINES
Crude Comes In (Again)
02/07/06 07:45:41 AMby David Penn
Bouncing off support from a years-long trend channel, crude oil's short-term weakness could be a prelude to longer-term strength.
Position: N/A
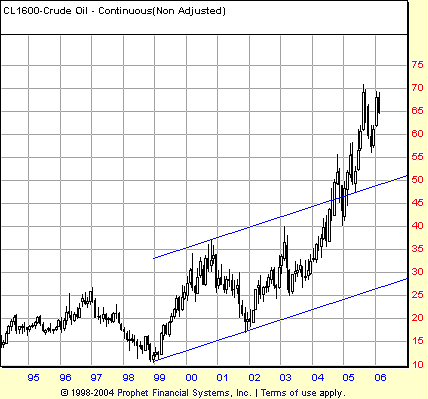
| Back in October 2005, I suggested that crude oil was likely to continue the uptrend that began back in late 2004 (see my "Is Crude Oil Ready To Run?" Traders.com Advantage, October 18, 2005). Although crude oil at the time was moving lower in the wake of a major peak in August 2005, I pointed to a number of factors — including positive divergences in the moving average convergence/divergence (MACD) histogram and stochastic — in the daily charts of continuous crude oil futures that suggested that the then-current move down was little more than a correction of crude oil's summer run in 2005. After all, basis continuous futures, crude oil ran from 49.30 at the beginning of May 2005 to 68.94 by the end of August. |

|
| FIGURE 1: CRUDE OIL, CONTINUOUS FUTURES, MONTHLY. Crude oil futures broke out above their initial, stage 1, trend channel in late 2004 — and left the channel for good with a powerful rally over the summer of 2005. |
| Graphic provided by: Prophet Financial, Inc. |
| |
| The validity of this multiyear trend channel was confirmed by the correction that followed the summer 2005 breakout as crude oil prices retreated from late August to late November, taking the market down close to the top of the trend channel before reversing and spending most of December and January 2006 moving sharply higher (see Figure 1). |
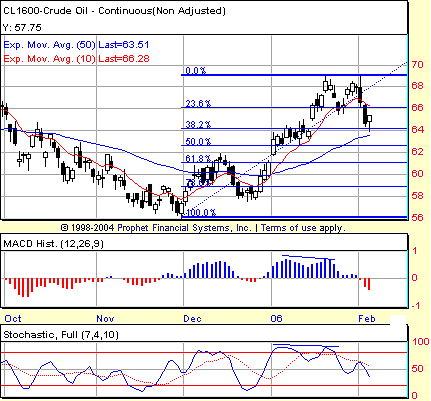
| It is quite possible that crude oil, which began correcting its December–January advance at the end of January and into February, has more downside to go. Crude oil became very extended toward the end of January, with the market failing two critical opportunities to close at the highs of the session on both January 20 and February 1. It is worth pointing out that the first, and higher, of those two highs came courtesy of negative divergences in both the MACD histogram and the stochastic (Figure 2). The resulting correction saw crude oil slip to retrace approximately a Fibonacci level of 38.2% of the advance from the late November low. In fact, the presence of the Fibonacci 38.2% — as well as potential support from the highs of early January and a 50-day exponential moving average (EMA) that hasn't quite rolled over — suggests that crude oil could bounce from these levels. With the stochastic showing the market to be increasingly oversold, there is additional credence to this possibility. |

|
| FIGURE 2: CRUDE OIL, CONTINUOUS FUTURES, DAILY. Negative divergences in both the stochastic and MACD histogram anticipated the correction in crude oil. Note that this A-B-C of the correction appears to have found some support at a level that coincides with previous resistance from early January, the 38.2% Fibonacci retracement level, and the 50-day exponential moving average (EMA). |
| Graphic provided by: Prophet Financial, Inc. |
| |
| The extent of the current correction will tell a great deal about the advance that began in crude oil in late 2005. If the market puts in a bottom at current levels, retracing only 38.2% of the previous rally, then that would indeed be a sign of great strength on the part of the bulls. At the same time, however, even a correction to as deep as 61.8% — another Fibonacci level — might still have bullish portents. The 61.8% retracement level coincides with the December highs, highs that might end up marking the first leg in a multilegged bull run. All this is at the 62 level — again, basis continuous futures. In the March contract, which is the current object of traders' attention, this level is closer to 63.5, and in the June contract, this level is closer to 64. |
| But the message is the same should crude oil retreat to these levels and find support: higher crude oil prices, potentially much higher crude oil prices, are just around the corner. |
Technical Writer for Technical Analysis of STOCKS & COMMODITIES magazine, Working-Money.com, and Traders.com Advantage.
| Title: | Technical Writer |
| Company: | Technical Analysis, Inc. |
| Address: | 4757 California Avenue SW |
| Seattle, WA 98116 | |
| Phone # for sales: | 206 938 0570 |
| Fax: | 206 938 1307 |
| Website: | www.Traders.com |
| E-mail address: | DPenn@traders.com |
Traders' Resource Links | |
| Charting the Stock Market: The Wyckoff Method -- Books | |
| Working-Money.com -- Online Trading Services | |
| Traders.com Advantage -- Online Trading Services | |
| Technical Analysis of Stocks & Commodities -- Publications and Newsletters | |
| Working Money, at Working-Money.com -- Publications and Newsletters | |
| Traders.com Advantage -- Publications and Newsletters | |
| Professional Traders Starter Kit -- Software | |
Click here for more information about our publications!
Comments
Date: 02/07/06Rank: 3Comment:
Date: 02/08/06Rank: 4Comment:

Request Information From Our Sponsors
- StockCharts.com, Inc.
- Candle Patterns
- Candlestick Charting Explained
- Intermarket Technical Analysis
- John Murphy on Chart Analysis
- John Murphy's Chart Pattern Recognition
- John Murphy's Market Message
- MurphyExplainsMarketAnalysis-Intermarket Analysis
- MurphyExplainsMarketAnalysis-Visual Analysis
- StockCharts.com
- Technical Analysis of the Financial Markets
- The Visual Investor
- VectorVest, Inc.
- Executive Premier Workshop
- One-Day Options Course
- OptionsPro
- Retirement Income Workshop
- Sure-Fire Trading Systems (VectorVest, Inc.)
- Trading as a Business Workshop
- VectorVest 7 EOD
- VectorVest 7 RealTime/IntraDay
- VectorVest AutoTester
- VectorVest Educational Services
- VectorVest OnLine
- VectorVest Options Analyzer
- VectorVest ProGraphics v6.0
- VectorVest ProTrader 7
- VectorVest RealTime Derby Tool
- VectorVest Simulator
- VectorVest Variator
- VectorVest Watchdog
