

HOT TOPICS LIST
- MACD
- Fibonacci
- RSI
- Gann
- ADXR
- Stochastics
- Volume
- Triangles
- Futures
- Cycles
- Volatility
- ZIGZAG
- MESA
- Retracement
- Aroon
INDICATORS LIST
LIST OF TOPICS
PRINT THIS ARTICLE
by David Penn
A monthly view of the 2002–06 bull market in stocks suggests that the higher we go, the weaker we get.
Position: N/A
David Penn
Technical Writer for Technical Analysis of STOCKS & COMMODITIES magazine, Working-Money.com, and Traders.com Advantage.
PRINT THIS ARTICLE
MACD
A Long-Term Look At The S&P 500
02/06/06 12:53:55 PMby David Penn
A monthly view of the 2002–06 bull market in stocks suggests that the higher we go, the weaker we get.
Position: N/A
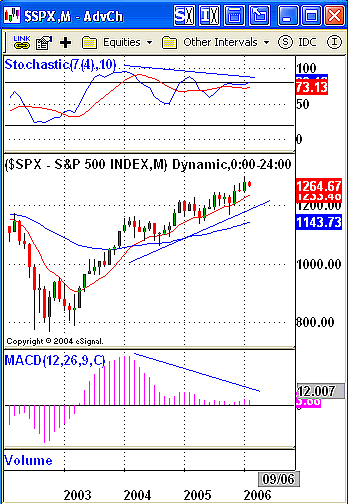
Nothing beats an extremely positive moving average convergence/divergence (MACD) histogram. When these histogram extremes appear as a market is rallying from what appears to be a bottom, they are often anticipating significant upside to come. I've made this point in articles for both Traders.com Advantage and Working Money.com. But you don't have to take my word for it. Consider the observations made by Alexander Elder in his book Trading For A Living:MACD-Histogram works like headlights on a car — it gives traders a glimpse of the road ahead. New highs and lows in this indicator are usually followed by new high or low prices. A record peak for the past three months in daily MACD-Histogram shows that bulls are very strong and prices are likely to rise even higher. A record new low for MACD-Histogram for the past three months shows that lower prices are likely ahead. There are times, of course, when the histogram will perform more accurately than others. But in terms of choosing those factors that will weigh on a decision to bet on the side of rising prices or falling prices going forward, the MACD histogram is as good or better than most. All of this leads me to this long-term, monthly chart of the Standard & Poor's 500 — and the potential signals being given by both the MACD histogram and the stochastic. |
|
| FIGURE 1: S&P 500, MONTHLY. Ever since the peak in late 2003, the S&P 500 has been creating negative divergences in both the MACD histogram and the stochastic with every new high in price. |
| Graphic provided by: eSignal. |
| |
| A monthly look at the bull market in the S&P 500 since the bottom in late 2002 is instructive on a number of levels. First of all, it is clear that we are in — or have been in — a bull market. The highs of 2006 are higher than the highs of 2005, the highs of 2005 higher than the highs of 2004, and the highs of 2004 higher than the highs of 2003. There are also four key lows — or three key higher lows, if you prefer. With the lows of August 2003 representing the first correction low of the new bull market, the next correction low in August 2004 was a higher low and the following correction lows in April 2005 and October 2005 each was higher than the last as well. |
| It is also easy to see why the market has been so frustrating for many in recent years. While the early part of the bull market — accompanied by the invasion of Iraq in the spring of 2003 — was largely an uninterrupted vault higher month after month, 2004 was largely a correction until the year's final months and 2005 moved as much sideways as it did in any other direction. |
| This frustration is perhaps registered elsewhere in Figure 1, the chart of the S&P 500 — namely, in the negative divergences in both the MACD histogram and the stochastic that accompany the market's move higher over the past few years. In short, the higher the market has moved, the lower the peaks in both of these key indicators. This kind of negative divergence suggests that upside momentum is continuing to wane and that the market will be prone to correction — if not outright reversal — as long as this pattern of negative divergences holds. |
| How, then, might this pattern be broken? The negative divergences are significant enough that for their bearishness to be dismissed entirely would require new highs in the stochastic and the MACD histogram. But that need not happen for the market to still make significant upside progress from current levels. For example, the chart shows monthly MACD histogram peaks on January 2004 and February 2005. There was a peak on July 2005, but that histogram peak was exceeded by the one created in January 2006. That negates the July 2005 histogram peak as far as analyzing the negative divergence is concerned, and sets up as the next challenge the MACD histogram peak from February 2005. In the meanwhile, because the S&P 500 did not break down after the July 2005 histogram peak but instead moved higher, it is likely that any correction in the near term will prove to be a buying opportunity as both the MACD histogram and the stochastic move toward forming a true "third" peak in the negative divergence that has accompanied this four-year bull market. |
Technical Writer for Technical Analysis of STOCKS & COMMODITIES magazine, Working-Money.com, and Traders.com Advantage.
| Title: | Technical Writer |
| Company: | Technical Analysis, Inc. |
| Address: | 4757 California Avenue SW |
| Seattle, WA 98116 | |
| Phone # for sales: | 206 938 0570 |
| Fax: | 206 938 1307 |
| Website: | www.Traders.com |
| E-mail address: | DPenn@traders.com |
Traders' Resource Links | |
| Charting the Stock Market: The Wyckoff Method -- Books | |
| Working-Money.com -- Online Trading Services | |
| Traders.com Advantage -- Online Trading Services | |
| Technical Analysis of Stocks & Commodities -- Publications and Newsletters | |
| Working Money, at Working-Money.com -- Publications and Newsletters | |
| Traders.com Advantage -- Publications and Newsletters | |
| Professional Traders Starter Kit -- Software | |
Click here for more information about our publications!
Comments
Date:�02/06/06Rank:�3Comment:�
Date:�02/07/06Rank:�5Comment:�
Date:�02/07/06Rank:�5Comment:�
Date:�02/14/06Rank:�3Comment:�

Request Information From Our Sponsors
- StockCharts.com, Inc.
- Candle Patterns
- Candlestick Charting Explained
- Intermarket Technical Analysis
- John Murphy on Chart Analysis
- John Murphy's Chart Pattern Recognition
- John Murphy's Market Message
- MurphyExplainsMarketAnalysis-Intermarket Analysis
- MurphyExplainsMarketAnalysis-Visual Analysis
- StockCharts.com
- Technical Analysis of the Financial Markets
- The Visual Investor
- VectorVest, Inc.
- Executive Premier Workshop
- One-Day Options Course
- OptionsPro
- Retirement Income Workshop
- Sure-Fire Trading Systems (VectorVest, Inc.)
- Trading as a Business Workshop
- VectorVest 7 EOD
- VectorVest 7 RealTime/IntraDay
- VectorVest AutoTester
- VectorVest Educational Services
- VectorVest OnLine
- VectorVest Options Analyzer
- VectorVest ProGraphics v6.0
- VectorVest ProTrader 7
- VectorVest RealTime Derby Tool
- VectorVest Simulator
- VectorVest Variator
- VectorVest Watchdog