HOT TOPICS LIST
- MACD
- Fibonacci
- RSI
- Gann
- ADXR
- Stochastics
- Volume
- Triangles
- Futures
- Cycles
- Volatility
- ZIGZAG
- MESA
- Retracement
- Aroon
INDICATORS LIST
LIST OF TOPICS
PRINT THIS ARTICLE
by Paolo Pezzutti
A shooting star candlestick pattern indicates at least a pause in the uptrend.
Position: N/A
Paolo Pezzutti
Author of the book "Trading the US Markets - A Comprehensive Guide to US Markets for International Traders and Investors" - Harriman House (July 2008)
PRINT THIS ARTICLE
TECHNICAL ANALYSIS
Test Of Resistance For Micron Technology
02/06/06 01:01:54 PMby Paolo Pezzutti
A shooting star candlestick pattern indicates at least a pause in the uptrend.
Position: N/A
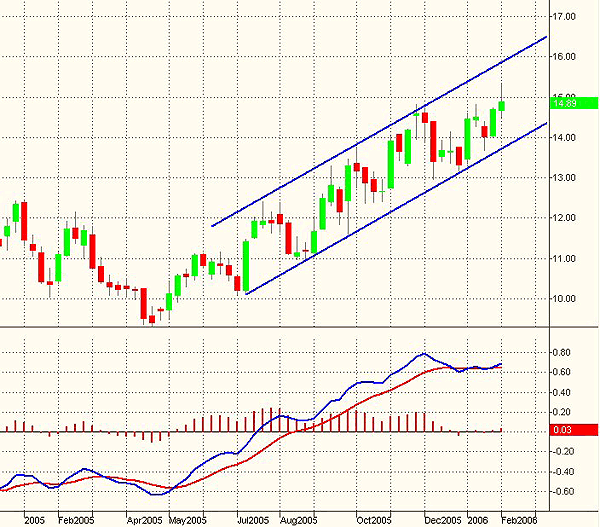
| Micron Technology's (MU) principal activities are to design, develop, manufacture, and market semiconductor products. Dynamic random access memory (DRAM) is the primary semiconductor memory product. In Figure 1, you can see that the weekly chart displays an uptrend in April 2005 at $9.50 to reach the high of $15.35 last week. The stock moved within a positively inclined channel, testing the upper and lower trendlines several times. Because of this, the channel is considered to provide reliable indications. In this time frame, the average directional movement index (ADX) during the uptrend moved up to reach the 31 level in December 2005. The recent top printed a lower ADX in coincidence with a consolidation move developed by the stock. The consolidation is confirmed by the moving average convergence/divergence (MACD) indicator that displays a declining MACDiff (red histogram), which is the difference between the MACD and the MACD average. |

|
| FIGURE 1: MICRON, WEEKLY. The stock has been moving within a positively inclined channel since April 2005. |
| Graphic provided by: TradeStation. |
| |
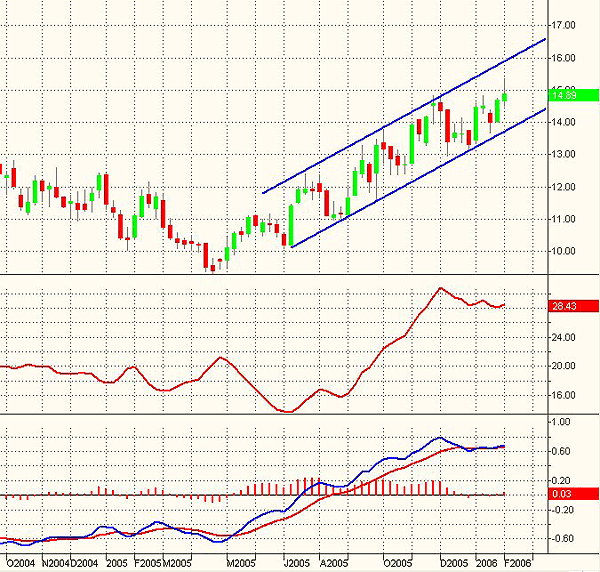
| In Figure 2, the daily time frame confirms this analysis with the ADX at a value of about 16 and Bollinger Bands parallel. It seems that for the moment, the stock is not able to continue and tag again the upper trendline after the successful test of its supports at $13 in December 2005. |

|
| FIGURE 2: MICRON, WEEKLY. The ADX and the MACD indicators confirm the sideways market developed during the past weeks. |
| Graphic provided by: TradeStation. |
| |
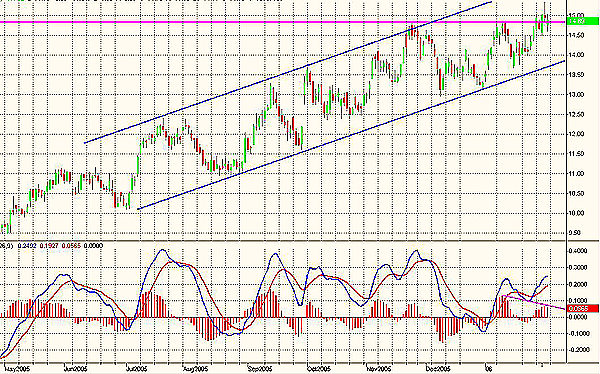
| In Figure 3, you can see the daily chart with prices moving smoothly within the rising channel. Note, however, that since last November prices have not managed to break out the resistance at $14.80. In fact, a first test failed on December 12-13 and a second test failed last week. The MACD arrived to the resistance level, printing negative divergences in both cases. Probably, more accumulation is needed at lower prices before trying again the assault to the resistance. |

|
| FIGURE 3: MICRON, DAILY. Prices tested the upper and lower trendlines several times. |
| Graphic provided by: TradeStation. |
| |
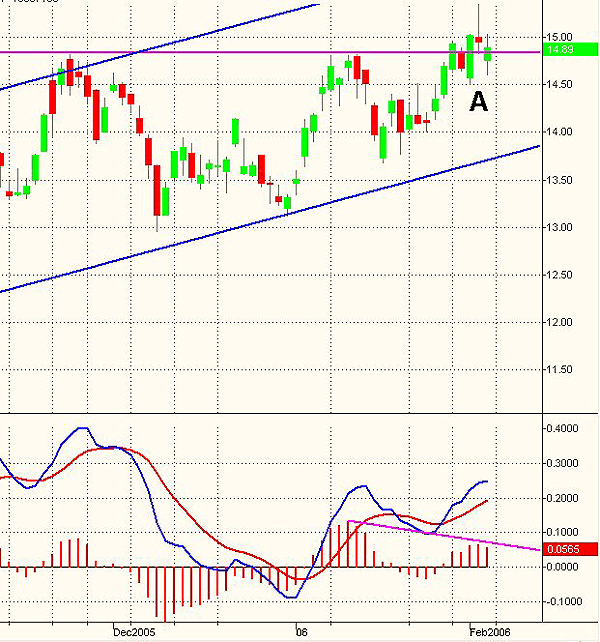
| In Figure 4, a detail of what occurred during the past trading sessions shows that a sort of bull trap developed, with prices giving the impression to have won the resistance on the trend day of February 1. The next day, a shooting star candlestick pattern (point A) opened within the previous day's range, then rallied to new highs, only to close the day lower. A shooting star is a pattern that provides a warning of an impending top. It looks like its name, a shooting star. It is usually not a major reversal signal. It has a small real body at the lower end of its range, with a long upper shadow. An ideal shooting star has a real body that gaps away from the prior real body. Nonetheless, this gap is not always necessary. The pattern has a value in the short term, providing indications of weakness. It now places the resistance at $15.35. |

|
| FIGURE 4: MICRON, DAILY. A shooting star pattern in coincidence with a MacDiff negative divergence at point A places a new resistance to the continuation of the up move. |
| Graphic provided by: TradeStation. |
| |
| Prices could move down and test the support now positioned in the $14 area. The stock could also develop a congestion close to the resistance level. This would provide an indication of strength. In any case, this phase is crucial to understand if the uptrend continues or if a deeper correction is about to develop. If you intend to open a long trade on this stock, I would suggest waiting for the development of a short-term reversal formation at its support. Another option is to trade the breakout of the shooting star pattern. |
Author of the book "Trading the US Markets - A Comprehensive Guide to US Markets for International Traders and Investors" - Harriman House (July 2008)
| Address: | VIA ROBERTO AGO 26 POSTAL CODE 00166 |
| Rome, ITALY | |
| Phone # for sales: | +393357540708 |
| E-mail address: | pezzutti.paolo@tiscali.it |
Click here for more information about our publications!
Comments
Date: 02/06/06Rank: 3Comment:

Request Information From Our Sponsors
- StockCharts.com, Inc.
- Candle Patterns
- Candlestick Charting Explained
- Intermarket Technical Analysis
- John Murphy on Chart Analysis
- John Murphy's Chart Pattern Recognition
- John Murphy's Market Message
- MurphyExplainsMarketAnalysis-Intermarket Analysis
- MurphyExplainsMarketAnalysis-Visual Analysis
- StockCharts.com
- Technical Analysis of the Financial Markets
- The Visual Investor
- VectorVest, Inc.
- Executive Premier Workshop
- One-Day Options Course
- OptionsPro
- Retirement Income Workshop
- Sure-Fire Trading Systems (VectorVest, Inc.)
- Trading as a Business Workshop
- VectorVest 7 EOD
- VectorVest 7 RealTime/IntraDay
- VectorVest AutoTester
- VectorVest Educational Services
- VectorVest OnLine
- VectorVest Options Analyzer
- VectorVest ProGraphics v6.0
- VectorVest ProTrader 7
- VectorVest RealTime Derby Tool
- VectorVest Simulator
- VectorVest Variator
- VectorVest Watchdog
