HOT TOPICS LIST
- MACD
- Fibonacci
- RSI
- Gann
- ADXR
- Stochastics
- Volume
- Triangles
- Futures
- Cycles
- Volatility
- ZIGZAG
- MESA
- Retracement
- Aroon
INDICATORS LIST
LIST OF TOPICS
PRINT THIS ARTICLE
by Paolo Pezzutti
In the short term, prices are printing an impulse to the downside.
Position: Sell
Paolo Pezzutti
Author of the book "Trading the US Markets - A Comprehensive Guide to US Markets for International Traders and Investors" - Harriman House (July 2008)
PRINT THIS ARTICLE
TECHNICAL ANALYSIS
Internet HOLDRS: Is Weakness Indicated?
02/06/06 03:17:35 PMby Paolo Pezzutti
In the short term, prices are printing an impulse to the downside.
Position: Sell
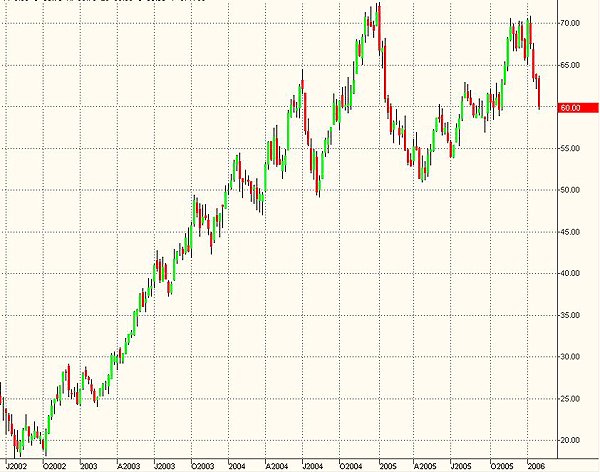
| Investors still cautious after the dotcom bubble may be surprised that one of the best-performing US exchange-traded funds over the past three years tracks the Internet sector. Since October 2002, Internet HOLDRS (HHH) moved from $20 to more than $60 (Figure 1). The price, however, is now below the December 2004 value. The market is more news-driven and overreacting to news than it has in the past months. Amazon, Yahoo!, Google, and eBay stocks slumped after releasing earning reports during the past days. |

|
| FIGURE 1: INTERNET HOLDRS, WEEKLY. Prices failed the retest of 2004 highs. |
| Graphic provided by: TradeStation. |
| |
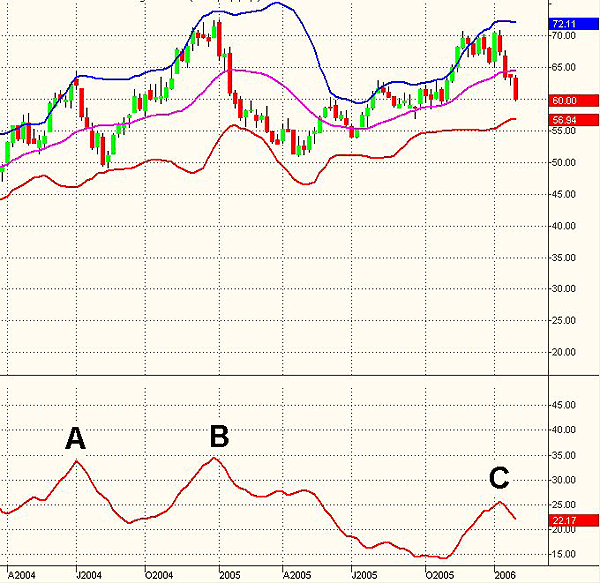
| In Figure 2, you can see the weekly chart of HHH. The average directional movement index (ADX) measures the trend quality of a security, independent of direction; the greater the ADX value, the stronger a security is trending. Traditionally, values above 30 are assumed to indicate an ongoing trend. At points A and B, the ADX did not confirm the new relative highs printed during the uptrend and displayed a negative divergence. The January 2006 high saw again lower values of the ADX that now is declining, printing a value of about 22. In this time frame, there is no indication of an ongoing trend. This analysis is confirmed by the Bollinger Bands, which are parallel. Prices are moving fast toward the lower band, but so far, this move has not influenced the indicators. |

|
| FIGURE 2: INTERNET HOLDRS, WEEKLY. The ADX displayed negative divergences during the uptrend. |
| Graphic provided by: TradeStation. |
| |
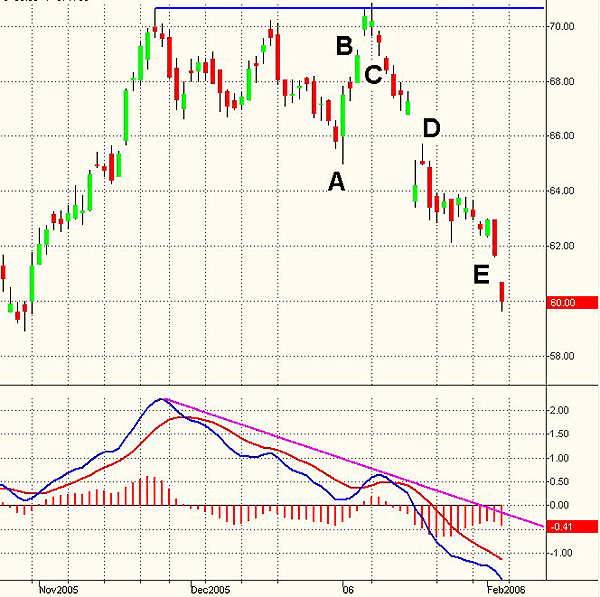
| In Figure 3, the daily time frame confirms the weakness of the Internet sector. After the double top printed between November and December 2005, prices moved lower (point A) with an a-b-c correction toward the formation short-term objective. This move revealed itself as a bear trap. Prices soared again and reached new highs in a few sessions. At point B, you also have a final gap before the failed test of the previous highs. Point C, in fact, printed a perfect Turtle Soup pattern on January 9. The aim of the pattern is to profit from false breakouts. It is a short-term swing trading pattern, working well in volatile markets. Sometimes, reversals can be quite profitable. The rules for a short trade are: - Today, you must have a new 20-day high and the previous 20-day high must be at least four days earlier. - After the new high has occurred, place an entry sell-short stop five to 10 ticks below the previous 20-day high. The stop-loss is one tick under today's low. A trailing stop can be used for this type of trade. The setup of point C has been incredibly profitable. It is quite rare to see it develop this way. Prices moved fast to the downside, trapping bulls and weak long hands. The volatility increased to the downside. Point D -- a runway gap -- and point E -- a continuation gap -- are indicating that in this time frame, prices are heading down. The moving average convergence/divergence (MACD) has been declining since last November, printing negative divergences in coincidence with the December 2005 and January 2006 highs. Now the indicator is negative and heading down. Only the MacDiff (red histogram), which is the difference between the MACD and the MACD average, is not confirming the new price low. |

|
| FIGURE 3: INTERNET HOLDRS, DAILY. A fast movement to the downside is bringing prices toward the first supports. |
| Graphic provided by: TradeStation. |
| |
| Given the situation, I would not open long positions on this asset. It is true that at the weekly level, indications are, so far, for a sideways market, but in the daily time frame, an impulse to the downside is still ongoing. I'd rather wait for Internet HOLDRS to test medium-term supports in the $58.50 and $54 areas. In order to control risk, at least a short-term reversal formation should develop before considering a trade to the upside. The closure of the gap (point E) at $61.62 is a significant resistance in the short term. This type of market is volatile and risk control should be an important component of your trading tactics. |
Author of the book "Trading the US Markets - A Comprehensive Guide to US Markets for International Traders and Investors" - Harriman House (July 2008)
| Address: | VIA ROBERTO AGO 26 POSTAL CODE 00166 |
| Rome, ITALY | |
| Phone # for sales: | +393357540708 |
| E-mail address: | pezzutti.paolo@tiscali.it |
Click here for more information about our publications!
Comments
Date: 02/06/06Rank: 3Comment:
Date: 02/06/06Rank: 5Comment:

Request Information From Our Sponsors
- StockCharts.com, Inc.
- Candle Patterns
- Candlestick Charting Explained
- Intermarket Technical Analysis
- John Murphy on Chart Analysis
- John Murphy's Chart Pattern Recognition
- John Murphy's Market Message
- MurphyExplainsMarketAnalysis-Intermarket Analysis
- MurphyExplainsMarketAnalysis-Visual Analysis
- StockCharts.com
- Technical Analysis of the Financial Markets
- The Visual Investor
- VectorVest, Inc.
- Executive Premier Workshop
- One-Day Options Course
- OptionsPro
- Retirement Income Workshop
- Sure-Fire Trading Systems (VectorVest, Inc.)
- Trading as a Business Workshop
- VectorVest 7 EOD
- VectorVest 7 RealTime/IntraDay
- VectorVest AutoTester
- VectorVest Educational Services
- VectorVest OnLine
- VectorVest Options Analyzer
- VectorVest ProGraphics v6.0
- VectorVest ProTrader 7
- VectorVest RealTime Derby Tool
- VectorVest Simulator
- VectorVest Variator
- VectorVest Watchdog
