HOT TOPICS LIST
- MACD
- Fibonacci
- RSI
- Gann
- ADXR
- Stochastics
- Volume
- Triangles
- Futures
- Cycles
- Volatility
- ZIGZAG
- MESA
- Retracement
- Aroon
INDICATORS LIST
LIST OF TOPICS
PRINT THIS ARTICLE
by David Penn
A take on a tale of two divergences in the late January rally in the NYSE.
Position: N/A
David Penn
Technical Writer for Technical Analysis of STOCKS & COMMODITIES magazine, Working-Money.com, and Traders.com Advantage.
PRINT THIS ARTICLE
REVERSAL
Divergences In Trends
02/03/06 02:22:53 PMby David Penn
A take on a tale of two divergences in the late January rally in the NYSE.
Position: N/A
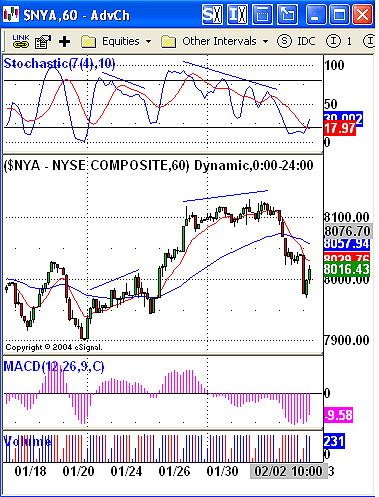
| What should speculators do with negative divergences? If negative divergences point to a lessening of upside momentum, then does that mean that negative divergences should be played as shorts or merely as warnings of potential weakness -- weakness that may end up being as mild as a sideways correction (Figure 1)? |

|
| FIGURE 1: NEW YORK STOCK EXCHANGE COMPOSITE, HOURLY. A short-term, negative divergence early in the Composite’s rally produces a similarly short-term, mild correction. A longer-term, negative divergence days later has comparably more severe consequences. |
| Graphic provided by: eSignal. |
| |
| All negative divergences do is reflect a loss of upside momentum. As such, they are as fundamentally a part of trends as brakes are on an automobile. In the same way that brakes on a car sometimes are used to begin a change of direction but are most often used to temporarily slow movement in the same direction, so do negative divergences frequently serve to warn speculators primarily that the current pace is unsustainable, not necessarily that the current direction is somehow false and must be reversed. This is especially worth remembering as negative divergences appear early in trends. When markets make significant lows and begin their first thrusts higher, it is typically not only for those markets to become quickly overbought, but also for that initial advance to create a negative divergence. Note how the advance on January 20 in Figure 1 seems to become almost instantly overbought in the stochastic. The next two peaks produce stochastic peaks that are lower than the initial one as the market moves higher. A negative divergence is created. Time to sell? |

|
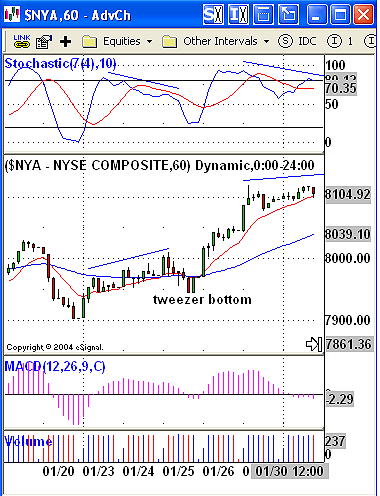
| FIGURE 2: NEW YORK STOCK EXCHANGE COMPOSITE, HOURLY. A tweezer bottom forms late in the trading day, hinting at a bear trap for shorts looking to trade a breakdown from a negative divergence. |
| Graphic provided by: eSignal. |
| |
| There are a number of confirming methods I've used to determine when a countertrend bet following a negative divergence is worth making (see my "Confirming Divergences," Working Money, December 22, 2004). One simple way is to look for a close below the low of the allegedly "topping" price action as suggested by the initial peak of the negative divergence. So with regard to the negative stochastic divergence that begins around mid-session on January 23, the low that must be violated to confirm the negative divergence is at approximately 7944.02. Unfortunately, a short trade when prices broke below 7944.02 on January 25 -- by less than a full point, no less -- would have led speculators directly into a bear trap. That bear trap came in the form of a tweezer bottom that likely would have sent short-side traders scurrying for the exits, covering shorts and establishing a significant, short-term bottom (Figure 2). Nevertheless, if failed shorts make for great longs, then those bears savvy enough to reverse their positions were well-rewarded as the market rallied sharply from that lows of late January. And once again after some powerful acceleration, the market moved for the brake pedal in the form of another negative divergence. Here, short-side speculators -- and longs looking to use short signals to make timely exits -- found gold in confirmation of the bearish implications of the negative divergence. The difference from the last time the market made an extended negative divergence is that this time the market had made a significant advance and was thus far more vulnerable to a correction than a market that had already fallen a great deal (as had the market in mid-January when the earlier negative divergence occurred). Again, negative divergences early in trends should be looked at differently from those occurring later in trends. In fact, an Elliott wave-influenced take on such divergences might even suggest that because the earlier negative divergence was not profitably tradable, the subsequent one would be. |

|
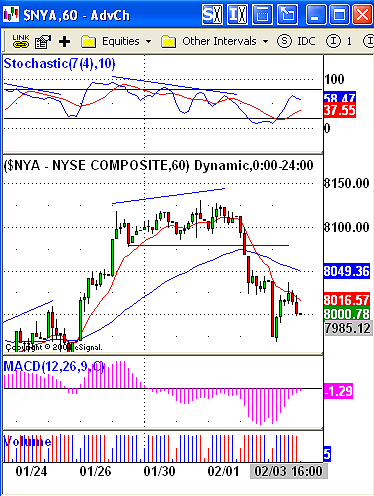
| FIGURE 3: NEW YORK STOCK EXCHANGE COMPOSITE, HOURLY. Breaking down below the low of the range that developed during the negative stochastic divergence was the confirmation that lower prices were ahead for stocks on the NYSE. |
| Graphic provided by: eSignal. |
| |
| That certainly seems to have been the case on February 2, when the $NYA fell below the lows of the upwardly cast, topping price action from January 27 to February 1 (again, as delineated by the range of the negative stochastic divergence). That low was at 8076.35. Five hours later, the market was at 8037.7 to close the trading day. The next day, the market was down to 7974.61 at the end of the first hour of trading. See Figure 3. |
| Especially with hourly charts -- which bridge the gap between daily charts and those charts used by daytraders (anything from 15-minute charts all the way down to tick charts) -- it is important to keep the prevailing trends in mind when trying to gauge the potential downside of a negative divergence. On the daily charts, the $NYA had not traded below its 50-day exponential moving average since early November. That suggested that the prevailing uptrend was still intact. Thus, negative divergences in hourly charts were likely to prove corrections best made for either profit-taking or short-term swing short trading, and shouldn't be confused with the sort of seismic trend change that would lead a speculator to overcommit precious capital on a countertrend bet. In fact, during prevailing uptrends in the daily chart, the sort of divergences a speculator should be looking for on hourly charts aren't negative ones; they are positive ones. For it is the positive divergences in the hourly chart that will ultimately tip off the speculator to changes in the daily chart that have yet to reveal themselves. |
Technical Writer for Technical Analysis of STOCKS & COMMODITIES magazine, Working-Money.com, and Traders.com Advantage.
| Title: | Technical Writer |
| Company: | Technical Analysis, Inc. |
| Address: | 4757 California Avenue SW |
| Seattle, WA 98116 | |
| Phone # for sales: | 206 938 0570 |
| Fax: | 206 938 1307 |
| Website: | www.Traders.com |
| E-mail address: | DPenn@traders.com |
Traders' Resource Links | |
| Charting the Stock Market: The Wyckoff Method -- Books | |
| Working-Money.com -- Online Trading Services | |
| Traders.com Advantage -- Online Trading Services | |
| Technical Analysis of Stocks & Commodities -- Publications and Newsletters | |
| Working Money, at Working-Money.com -- Publications and Newsletters | |
| Traders.com Advantage -- Publications and Newsletters | |
| Professional Traders Starter Kit -- Software | |
Click here for more information about our publications!
Comments
Date: 02/04/06Rank: 3Comment:

Request Information From Our Sponsors
- StockCharts.com, Inc.
- Candle Patterns
- Candlestick Charting Explained
- Intermarket Technical Analysis
- John Murphy on Chart Analysis
- John Murphy's Chart Pattern Recognition
- John Murphy's Market Message
- MurphyExplainsMarketAnalysis-Intermarket Analysis
- MurphyExplainsMarketAnalysis-Visual Analysis
- StockCharts.com
- Technical Analysis of the Financial Markets
- The Visual Investor
- VectorVest, Inc.
- Executive Premier Workshop
- One-Day Options Course
- OptionsPro
- Retirement Income Workshop
- Sure-Fire Trading Systems (VectorVest, Inc.)
- Trading as a Business Workshop
- VectorVest 7 EOD
- VectorVest 7 RealTime/IntraDay
- VectorVest AutoTester
- VectorVest Educational Services
- VectorVest OnLine
- VectorVest Options Analyzer
- VectorVest ProGraphics v6.0
- VectorVest ProTrader 7
- VectorVest RealTime Derby Tool
- VectorVest Simulator
- VectorVest Variator
- VectorVest Watchdog
