HOT TOPICS LIST
- MACD
- Fibonacci
- RSI
- Gann
- ADXR
- Stochastics
- Volume
- Triangles
- Futures
- Cycles
- Volatility
- ZIGZAG
- MESA
- Retracement
- Aroon
INDICATORS LIST
LIST OF TOPICS
PRINT THIS ARTICLE
by Paolo Pezzutti
This pattern indicates weakness in the short term.
Position: Sell
Paolo Pezzutti
Author of the book "Trading the US Markets - A Comprehensive Guide to US Markets for International Traders and Investors" - Harriman House (July 2008)
PRINT THIS ARTICLE
CANDLESTICK CHARTING
Russell 2000 iShares Val Index: Bearish Engulfing Pattern
02/03/06 09:10:14 AMby Paolo Pezzutti
This pattern indicates weakness in the short term.
Position: Sell
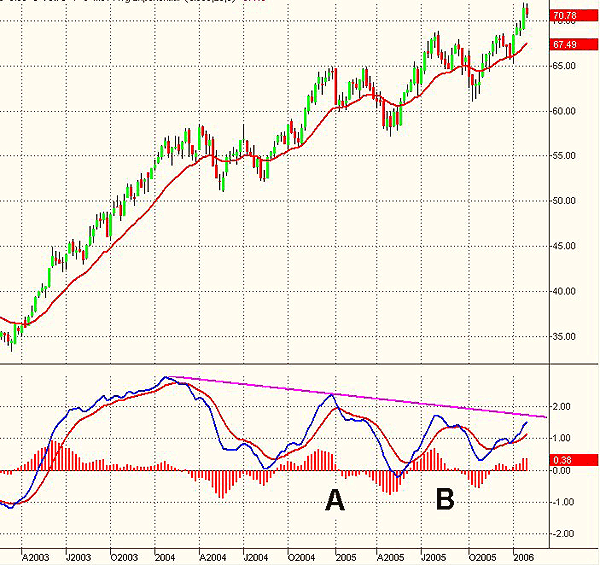
| As you can see in Figure 1, the Russell 2000 Val Index (IWN) doubled its price since April 2003, moving from $35 to $70. The uptrend in the weekly time frame has been steady and smooth. Note, however, that the moving average convergence/divergence (MACD) printed negative divergences in coincidence with the relative tops at points A and B, respectively, in December 2004 and August 2005. The MACD is now printing another divergence, indicating increasing risk at these price levels. Divergences alone cannot state the end of a trend. You can have many false signals before you have a correct indication. They are, however, a useful tool for traders to assess risk. |

|
| FIGURE 1: IWN, WEEKLY. Multiple negative divergences in coincidence with new relative highs indicate increased risk for long positions. |
| Graphic provided by: TradeStation. |
| |
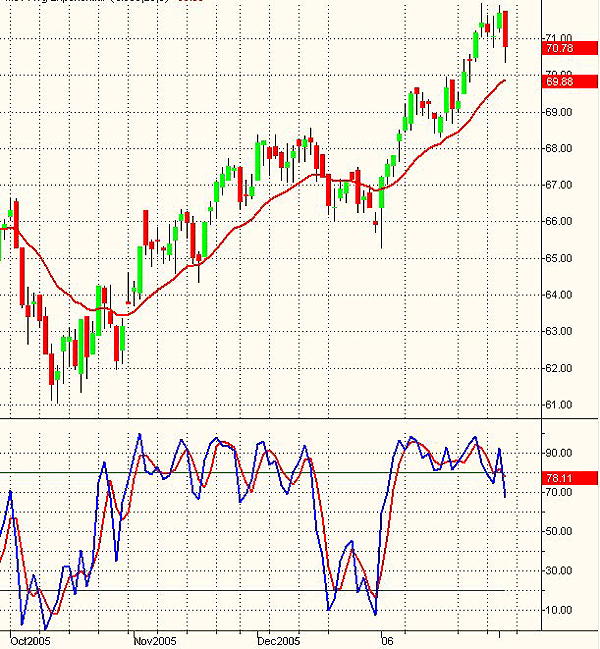
| At the daily level in Figure 2, the last leg of the uptrend started in October 2005, moving prices from $61 to the present value of $70.78. The last trading session printed a bearish engulfing candlestick pattern. |
| The engulfing pattern is a reversal pattern. The engulfing pattern consists of two candlesticks. The second body must begin and end above and below the first body. It gives the illusion of "engulfing" the first candlestick, and the two bodies must be different colors. The shadows or "wicks" are irrelevant in this pattern. In order to get a reversal signal, the security must be in a trend. For a top reversal, in an uptrend, the first candlestick body will be green, and the second, engulfing candlestick will be red. This can be explained in terms of market sentiment as the opposing bearish forces take control of the bulls, ending the day on a strong negative close. There are ways to confirm the signal that the engulfing pattern provides: 1. The second candlestick body is 30% larger than the first. 2. The third day confirms the reversal movement of the two-day formation. In a top reversal, the third day should close down. 3. Other indicators can be used to confirm trend reversals. |

|
| FIGURE 2: IWN, DAILY. The bearish engulfing pattern provides indication of weakness in the short term. |
| Graphic provided by: TradeStation. |
| |
| In Figure 2, I used the fast stochastic to confirm the pattern's indications. With the indicator overbought the risk of false signals are reduced. The long down candle brought the indicator below the overbought level, providing a signal of weakness in the short term. At the same time, the high of this formation represents a significant resistance for the uptrend to resume. The pattern started a consolidation phase. Also in the weekly time frame, indications are for increased risk at this level. In this situation, the stock should move and find a valid support to try and test recent highs again. I'd wait and see the development of this move to spot either a lower-entry point or trade the breakout of the engulfing pattern. |
Author of the book "Trading the US Markets - A Comprehensive Guide to US Markets for International Traders and Investors" - Harriman House (July 2008)
| Address: | VIA ROBERTO AGO 26 POSTAL CODE 00166 |
| Rome, ITALY | |
| Phone # for sales: | +393357540708 |
| E-mail address: | pezzutti.paolo@tiscali.it |
Click here for more information about our publications!
Comments
Date: 02/04/06Rank: 3Comment:

Request Information From Our Sponsors
- StockCharts.com, Inc.
- Candle Patterns
- Candlestick Charting Explained
- Intermarket Technical Analysis
- John Murphy on Chart Analysis
- John Murphy's Chart Pattern Recognition
- John Murphy's Market Message
- MurphyExplainsMarketAnalysis-Intermarket Analysis
- MurphyExplainsMarketAnalysis-Visual Analysis
- StockCharts.com
- Technical Analysis of the Financial Markets
- The Visual Investor
- VectorVest, Inc.
- Executive Premier Workshop
- One-Day Options Course
- OptionsPro
- Retirement Income Workshop
- Sure-Fire Trading Systems (VectorVest, Inc.)
- Trading as a Business Workshop
- VectorVest 7 EOD
- VectorVest 7 RealTime/IntraDay
- VectorVest AutoTester
- VectorVest Educational Services
- VectorVest OnLine
- VectorVest Options Analyzer
- VectorVest ProGraphics v6.0
- VectorVest ProTrader 7
- VectorVest RealTime Derby Tool
- VectorVest Simulator
- VectorVest Variator
- VectorVest Watchdog
