HOT TOPICS LIST
- MACD
- Fibonacci
- RSI
- Gann
- ADXR
- Stochastics
- Volume
- Triangles
- Futures
- Cycles
- Volatility
- ZIGZAG
- MESA
- Retracement
- Aroon
INDICATORS LIST
LIST OF TOPICS
PRINT THIS ARTICLE
by Paolo Pezzutti
A pattern based on the market facilitation index can help traders identify reversals.
Position: N/A
Paolo Pezzutti
Author of the book "Trading the US Markets - A Comprehensive Guide to US Markets for International Traders and Investors" - Harriman House (July 2008)
PRINT THIS ARTICLE
TECHNICAL ANALYSIS
Short-Term Reversal Pattern
02/03/06 01:57:28 PMby Paolo Pezzutti
A pattern based on the market facilitation index can help traders identify reversals.
Position: N/A
| This pattern can provide traders with a useful tool to reinforce their assessment about reversal points and their potential. It is based on the market facilitation index (MFI), which is defined as the ratio range/volume. This indicator provides you with the ability to determine the efficiency with which prices change and the market's capacity to move prices. According to Bill Williams, who presented it in his book Trading Chaos, by comparing changes of the previous bar's value of this index to changes in volume, it is possible to determine the interest that the market has in the current price trend. The method helps you determine if public involvement will have an impact on price movement. Among the four possible combinations, the most interesting with which to assess potential reversal points is a bar that prints a decrease of the MFI with respect to the previous bar and increase in volume. In this, the price is not moving strongly, but the volume is increasing. At turning points, this situation can generate significant moves in the opposite direction. Price action did not follow the flow of money that entered the market, while the move in the opposite direction can be quick. The formula is: MFI(volume) > MFI(volume)[1] and volume > volume[1]. This bar is called "squat." |
| Besides the indications provided by Bill Williams, this method can be used in a number of applications, focusing on specific situations. For example, you can use a squat bar when you have an overbought/oversold indication by an oscillator. The fast stochastic can be used to assess overbought and oversold situations. Of course, starting from these generic indications, you can add additional filters or use different oscillators. The rules to open long trades are: - Stochastic is oversold - A squat bar is printed - Enter the next bar at the breakout of the high of the squat bar - Place an initial stop-loss below the low of the squat bar. This analysis can be applied to different time frames. You can use a trailing stop to lock in profits in a short-term trade that typically lasts a few bars. The opposite rules are valid for short trades. |

|
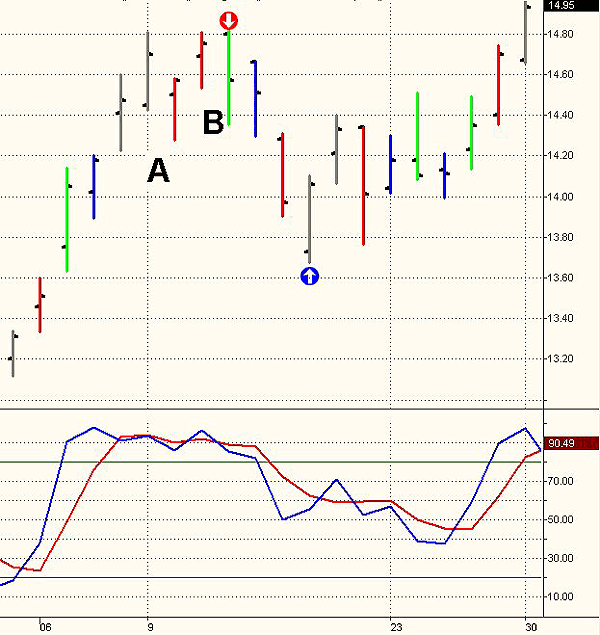
| FIGURE 1: MICRON. Micron prints a sell setup on the daily time frame. |
| Graphic provided by: TradeStation. |
| |
| Let's see some examples. In Figure 1, you can see that Micron on January 10 printed a first squat bar (in red) at point A. The next bar does not break out to the downside of the previous bar's low, but rather prints another squat, which is a setup to open a short trade (point B). The next bar, a short trade is opened at the breakout of the low of the squat bar. |

|
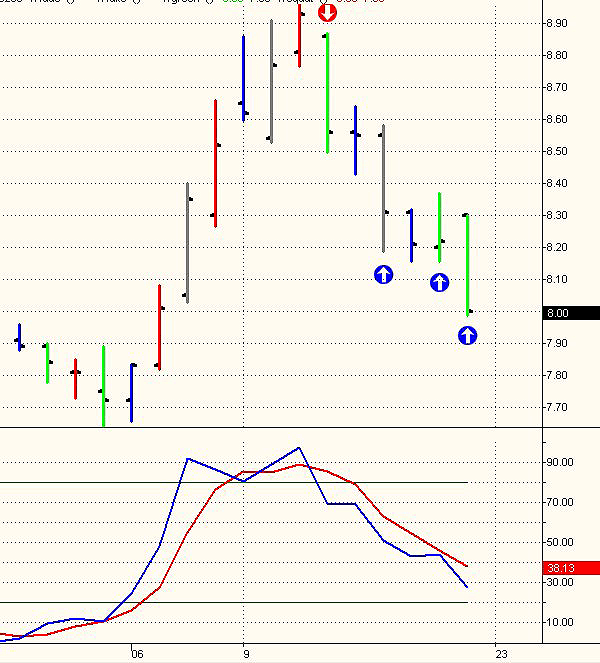
| FIGURE 2: FORD. Ford prints a fast expansion to the downside right after the short trade entry. |
| Graphic provided by: TradeStation. |
| |
| In Figure 2, Ford prints a similar situation on January 11 when a squat appeared in coincidence of the overbought stochastic. The next day, a short trade opened. This trade lasts from three to at least six bars, depending on the exit rule applied. |

|
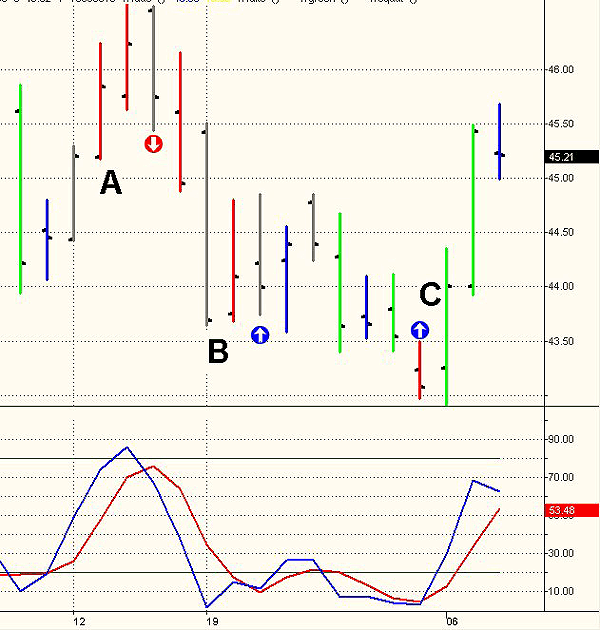
| FIGURE 3: QUALCOMM. Qualcomm presents three trading opportunities, with the last one at point C printing an increase in volatility to the upside. This is the ideal situation for this type of trade. |
| Graphic provided by: TradeStation. |
| |
| In Figure 3, Qualcomm prints a first successful setup at point A. A loss occurs at the setup at point B. Finally, an excellent trading opportunity occurs at point C when right after the squat bar, an expansion to the upside brings a windfall of profits in a short time. This method is not the Holy Grail of trading. You will have some small losses, only to find your profit in a few good trades soon thereafter. It is important in short-term trading to plan your trade and then follow your plan, strictly controlling your risk. |
Author of the book "Trading the US Markets - A Comprehensive Guide to US Markets for International Traders and Investors" - Harriman House (July 2008)
| Address: | VIA ROBERTO AGO 26 POSTAL CODE 00166 |
| Rome, ITALY | |
| Phone # for sales: | +393357540708 |
| E-mail address: | pezzutti.paolo@tiscali.it |
Click here for more information about our publications!
Comments
Date: 02/04/06Rank: 3Comment:

Request Information From Our Sponsors
- StockCharts.com, Inc.
- Candle Patterns
- Candlestick Charting Explained
- Intermarket Technical Analysis
- John Murphy on Chart Analysis
- John Murphy's Chart Pattern Recognition
- John Murphy's Market Message
- MurphyExplainsMarketAnalysis-Intermarket Analysis
- MurphyExplainsMarketAnalysis-Visual Analysis
- StockCharts.com
- Technical Analysis of the Financial Markets
- The Visual Investor
- VectorVest, Inc.
- Executive Premier Workshop
- One-Day Options Course
- OptionsPro
- Retirement Income Workshop
- Sure-Fire Trading Systems (VectorVest, Inc.)
- Trading as a Business Workshop
- VectorVest 7 EOD
- VectorVest 7 RealTime/IntraDay
- VectorVest AutoTester
- VectorVest Educational Services
- VectorVest OnLine
- VectorVest Options Analyzer
- VectorVest ProGraphics v6.0
- VectorVest ProTrader 7
- VectorVest RealTime Derby Tool
- VectorVest Simulator
- VectorVest Variator
- VectorVest Watchdog
