HOT TOPICS LIST
- MACD
- Fibonacci
- RSI
- Gann
- ADXR
- Stochastics
- Volume
- Triangles
- Futures
- Cycles
- Volatility
- ZIGZAG
- MESA
- Retracement
- Aroon
INDICATORS LIST
LIST OF TOPICS
PRINT THIS ARTICLE
by David Penn
An old support level turned resistance suggests that prices for 10-year notes are likely to continue lower before moving higher.
Position: N/A
David Penn
Technical Writer for Technical Analysis of STOCKS & COMMODITIES magazine, Working-Money.com, and Traders.com Advantage.
PRINT THIS ARTICLE
SUPPORT & RESISTANCE
Return Of The Son Of Another Rate Rally
02/02/06 09:38:58 AMby David Penn
An old support level turned resistance suggests that prices for 10-year notes are likely to continue lower before moving higher.
Position: N/A
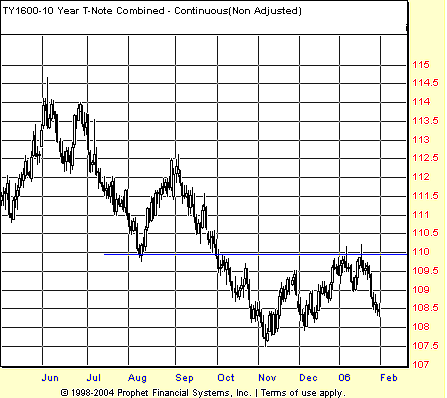
| The last time I wrote about the market for US Treasuries was back in October 2005 ("Another Rate Rally," Traders.com Advantage, October 3, 2005). At the time, I noted how a decline in prices for the 10-year bond -- with a corresponding rise in yields -- looked in the cards going forward. Ten-year notes had peaked in late August–early September 2005, and had spent the balance of September in a decline that was threatening to take out the lows of early August. Two of my favorite analytic/trading screens -- the "histochastic" screen and the BOSO screen -- both suggested that more downside was likely. At the time, basis continuous futures, the 10-year Treasury was trading at about 110. See Figure 1. |

|
| FIGURE 1: 10-YEAR TREASURY NOTE, CONTINUOUS FUTURES, DAILY. The 10-year note broke down beneath support at 110 in late September 2005 and continued to decline until early November, when it found support at 107.5. Note how the bounce in the 10-year note found resistance in January 2006 at 110 — a level that had previously provided support. |
| Graphic provided by: Prophet Financial, Inc. |
| |
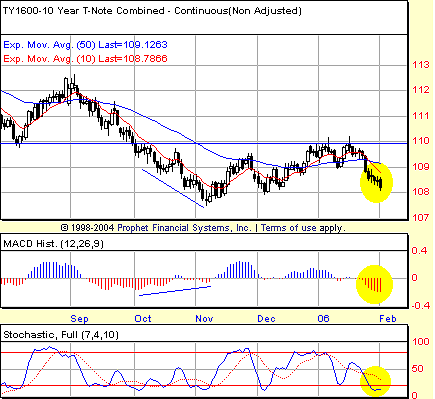
| The 10-year note eventually fell as low as 107.5 before bouncing -- right back to the old support level at 110. But the retreat from 110 -- announced by an intramonth 2B top in January -- has been swift, retracing more than a Fibonacci level of 61.8% over the second half of the month. So for those looking at the market for 10-year Treasuries, the question in early February 2006 is similar to the one I considered back in late September 2005: Will the decline stop at the recent lows, or are new lows on the other side of the current weak market? Of course, there is no way to know in advance what the 10-year will do if and when it hits 107.5 until it does so. Nevertheless, we can study the chart for signs that the market's downside momentum is waxing or waning, or if there is a strong possibility of the sort of positive divergence that accompanies most if not all significant bottoms. For example, consider the chart of the continuous 10-year T-note futures in Figure 2. Note the depth of the moving average convergence/divergence (MACD) histogram that accompanies the January declines. |

|
| FIGURE 2: 10-YEAR TREASURY NOTE, CONTINUOUS FUTURES, DAILY. Positive divergences in the stochastic and MACD histogram accompanied the intermediate bottom in early November. New stochastic and MACD histogram lows in late January point to lower prices before another such intermediate bottom can be said to be in place. |
| Graphic provided by: Prophet Financial, Inc. |
| |
| Generally, when MACD histograms are making new lows, the accompanying lows in price are likely to be exceeded -- if even by a fraction -- before a bottom can be established. There are exceptions to this "rule," but insofar as technical analysis is largely a game of odds and angles, betting that a new low in the MACD histogram means lower lows in price are still to come is among the more reasonable wagers that can be made in the market. |

|
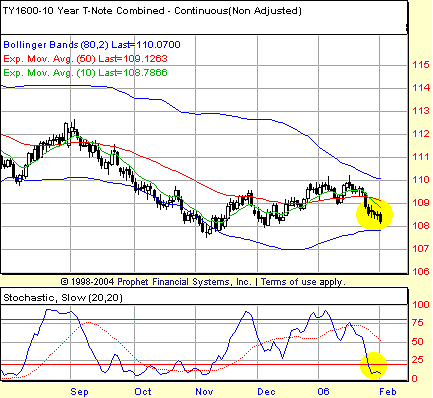
| FIGURE 3: 10-YEAR TREASURY NOTE, CONTINUOUS FUTURES, DAILY. A stochastic breakdown in late January underscores the potential for a significant move to the downside. Note also the contraction in the range of the Bollinger Bands. This reduction in volatility could prove a precursor to an expansion of volatility over the next several weeks — and a correspondingly “expansive” move in prices. |
| Graphic provided by: Prophet Financial, Inc. |
| |
| The BOSO screen (see my Working Money article, "BOSO," October 5, 2005) also has some interesting suggestions about the bearishness of the 10-year Treasury note. For one, the 10-year note experienced a stochastic breakdown in late January. By "stochastic breakdown," I'm referring simply to the point that the stochastic slipped into what is typically considered oversold territory. As I point out in the forementioned BOSO article, Jesse Livermore's admonition that markets are never too high to buy and never too low to sell is often confirmed by the way overbought markets will continue higher and oversold markets will continue lower. The BOSO screen is one way to help traders spot these opportunities as they happen. |
| In addition, note how the Bollinger Bands in late January have contracted compared to their range in previous months (Figure 3). While it is possible for markets to make significant moves when Bollinger Band ranges are wide, it is typically a contraction in the range of these bands that -- like a rectangular consolidation in a trending market -- develops between dramatic expansions in range. In other words, the narrowness of the Bollinger Bands now provides an opportunity for wider bands later. And those wider bands would come courtesy of a significant market move that -- while at least theoretically capable of being a move higher as well as lower -- increasingly appears to have more downside potential than upside potential based on the various aspects of this market already discussed. |
Technical Writer for Technical Analysis of STOCKS & COMMODITIES magazine, Working-Money.com, and Traders.com Advantage.
| Title: | Technical Writer |
| Company: | Technical Analysis, Inc. |
| Address: | 4757 California Avenue SW |
| Seattle, WA 98116 | |
| Phone # for sales: | 206 938 0570 |
| Fax: | 206 938 1307 |
| Website: | www.Traders.com |
| E-mail address: | DPenn@traders.com |
Traders' Resource Links | |
| Charting the Stock Market: The Wyckoff Method -- Books | |
| Working-Money.com -- Online Trading Services | |
| Traders.com Advantage -- Online Trading Services | |
| Technical Analysis of Stocks & Commodities -- Publications and Newsletters | |
| Working Money, at Working-Money.com -- Publications and Newsletters | |
| Traders.com Advantage -- Publications and Newsletters | |
| Professional Traders Starter Kit -- Software | |
Click here for more information about our publications!
Comments
Date: 02/04/06Rank: 3Comment:

Request Information From Our Sponsors
- StockCharts.com, Inc.
- Candle Patterns
- Candlestick Charting Explained
- Intermarket Technical Analysis
- John Murphy on Chart Analysis
- John Murphy's Chart Pattern Recognition
- John Murphy's Market Message
- MurphyExplainsMarketAnalysis-Intermarket Analysis
- MurphyExplainsMarketAnalysis-Visual Analysis
- StockCharts.com
- Technical Analysis of the Financial Markets
- The Visual Investor
- VectorVest, Inc.
- Executive Premier Workshop
- One-Day Options Course
- OptionsPro
- Retirement Income Workshop
- Sure-Fire Trading Systems (VectorVest, Inc.)
- Trading as a Business Workshop
- VectorVest 7 EOD
- VectorVest 7 RealTime/IntraDay
- VectorVest AutoTester
- VectorVest Educational Services
- VectorVest OnLine
- VectorVest Options Analyzer
- VectorVest ProGraphics v6.0
- VectorVest ProTrader 7
- VectorVest RealTime Derby Tool
- VectorVest Simulator
- VectorVest Variator
- VectorVest Watchdog
