HOT TOPICS LIST
- MACD
- Fibonacci
- RSI
- Gann
- ADXR
- Stochastics
- Volume
- Triangles
- Futures
- Cycles
- Volatility
- ZIGZAG
- MESA
- Retracement
- Aroon
INDICATORS LIST
LIST OF TOPICS
PRINT THIS ARTICLE
by Koos van der Merwe
Why is the Toronto 300 in a strong bull market while the DJIA is dithering?
Position: Buy
Koos van der Merwe
Has been a technical analyst since 1969, and has worked as a futures and options trader with First Financial Futures in Johannesburg, South Africa.
PRINT THIS ARTICLE
ELLIOTT WAVE
Why Is The Toronto 300 Index Bullish?
02/01/06 10:14:48 AMby Koos van der Merwe
Why is the Toronto 300 in a strong bull market while the DJIA is dithering?
Position: Buy
| The bullish wave count is my most recent, which changed from my original bearish count after the results of the federal election in Canada. |

|
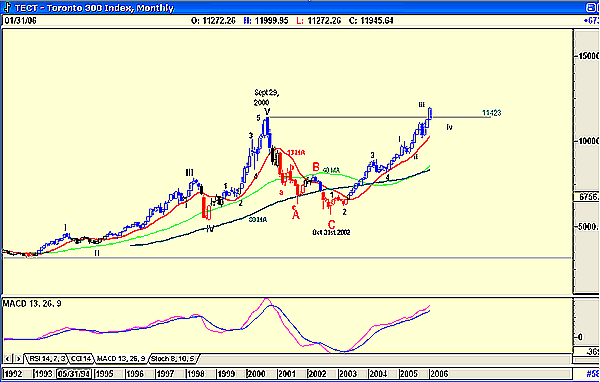
| FIGURE 1: TORONTO STOCK EXCHANGE INDEX, MONTHLY. The Toronto 300 has moved up strongly because of oil, gas, and gold. |
| Graphic provided by: AdvancedGET. |
| |
| The Toronto 300 Index (Figure 1) has moved up strongly because of oil, gas, and gold. However, the recent change in government, where two of the preelection promises made — a 1% cut in the GST, and no tax on capital gains if those gains are reinvested within six months — has strengthened the index even more. The Canadian dollar is at all-time highs, and confidence in the economy of the country has exceeded all expectations. Canada is booming despite the drag by a slowing US, Canada's biggest consumer. |
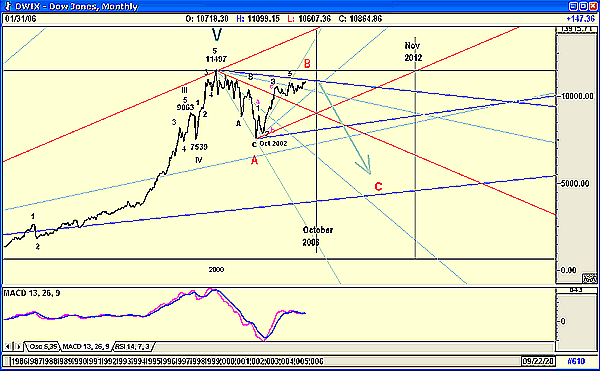
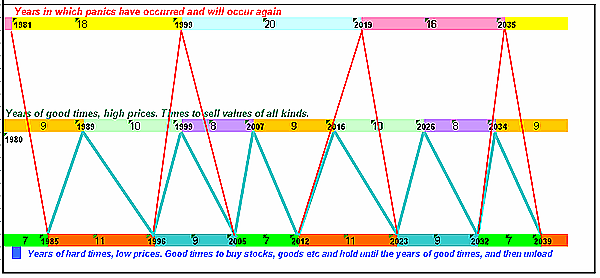
| As with the Dow Jones Industrial Average (Figure 2), I originally showed the low of October 31, 2002, as being a wave A, with a wave B upward to follow. The moving average convergence/divergence (MACD) oscillator is suggesting that wave B is topping, and the Gann fans are suggesting that the top could be where the two 1 x 1 lines cross in October 2006. Of course, the wave C that would follow would be the major recession called for by the Kondratieff wave for 2007 through 2012 (Figure 3). |

|
| FIGURE 2: DOW JONES INDUSTRIAL AVERAGE, MONTHLY. The DJIA's activity is in remarkable contrast to the Toronto 300. |
| Graphic provided by: AdvancedGET. |
| |
| With the Toronto Stock Exchange index (TSX) moving above the high of September 29, 2000, I decided to redo my wave count. Admittedly, I have seen instances where a major wave B has exceeded a wave V, but for a major wave count, this is the exception rather than the rule. The indicators are all extremely positive, and although I am expecting a short-term correction to complete wave iv, I am unable to say when it will occur, nor am I able to say what its true depth will be. The rule is that fourth waves are equal to second waves, but the correction of wave i to wave ii was small and simple. This means that the correction from wave iii to wave iv will be small but complicated. What has caused the change? With Iran striving to develop a nuclear bomb and now with Hamas, a military terrorist organization winning the Palestinian elections, the threat of a new conflict in the Middle East looks imminent. In the past, Israel has shown that it will not sit back and allow any country to pose a threat to its existence. Last week, a Hamas spokesman referred to the wall Israel has built between itself and Palestine as an "apartheid" wall, but since the wall was erected, there has been only one suicide bombing attack in Israel, whereas before the wall was put up, there was one almost every week. This shows Israel's determination to protect its citizens, no matter what. Israeli leader Ariel Sharon's incapacitation may be the only reason why Israel is currently acting defensively rather than aggressively. So with a world situation becoming more threatening, something that is reflected in the DJIA, why is Canada different? Why is Figure 1 so bullish? I can only conclude that it is because of the threat that access to Middle East oil can be reduced. We should never forget the tremendous growth in China and its huge demand for oil. Then, of course, there is gold, demonetized and mostly confined to jewelry, but investors in the world still see the precious metal as a safe haven in times of crises. Finally, about the promises made by the newly elected minority conservative government in Canada: The test, of course, will be whether they can or will keep those promises. A minority government may find it difficult to pass laws through Parliament quickly, but being the politician he is, I am sure that Stephen Harper, the Prime Minister–elect, knows that he has two years in which to prove himself. At the moment, the charts are optimistic, but remember that after a wave 5 comes a major ABC correction, and the Kondratieff wave. |

|
| FIGURE 3: KONDRATIEFF WAVE. A major recession is called for 2007 through 2012 — coming up fast. |
| Graphic provided by: AdvancedGET. |
| |
Has been a technical analyst since 1969, and has worked as a futures and options trader with First Financial Futures in Johannesburg, South Africa.
| Address: | 3256 West 24th Ave |
| Vancouver, BC | |
| Phone # for sales: | 6042634214 |
| E-mail address: | petroosp@gmail.com |
Click here for more information about our publications!
Comments
Date: 02/01/06Rank: 3Comment:

Request Information From Our Sponsors
- StockCharts.com, Inc.
- Candle Patterns
- Candlestick Charting Explained
- Intermarket Technical Analysis
- John Murphy on Chart Analysis
- John Murphy's Chart Pattern Recognition
- John Murphy's Market Message
- MurphyExplainsMarketAnalysis-Intermarket Analysis
- MurphyExplainsMarketAnalysis-Visual Analysis
- StockCharts.com
- Technical Analysis of the Financial Markets
- The Visual Investor
- VectorVest, Inc.
- Executive Premier Workshop
- One-Day Options Course
- OptionsPro
- Retirement Income Workshop
- Sure-Fire Trading Systems (VectorVest, Inc.)
- Trading as a Business Workshop
- VectorVest 7 EOD
- VectorVest 7 RealTime/IntraDay
- VectorVest AutoTester
- VectorVest Educational Services
- VectorVest OnLine
- VectorVest Options Analyzer
- VectorVest ProGraphics v6.0
- VectorVest ProTrader 7
- VectorVest RealTime Derby Tool
- VectorVest Simulator
- VectorVest Variator
- VectorVest Watchdog
