HOT TOPICS LIST
- MACD
- Fibonacci
- RSI
- Gann
- ADXR
- Stochastics
- Volume
- Triangles
- Futures
- Cycles
- Volatility
- ZIGZAG
- MESA
- Retracement
- Aroon
INDICATORS LIST
LIST OF TOPICS
PRINT THIS ARTICLE
by David Penn
A classic "two-stick" candlestick pattern augurs a bounce in Honeywell.
Position: N/A
David Penn
Technical Writer for Technical Analysis of STOCKS & COMMODITIES magazine, Working-Money.com, and Traders.com Advantage.
PRINT THIS ARTICLE
CANDLESTICK CHARTING
Honeywell's Piercing Pattern Bottom
01/31/06 01:21:22 PMby David Penn
A classic "two-stick" candlestick pattern augurs a bounce in Honeywell.
Position: N/A
| Merriam-Webster provides two definitions for "conglomerate." The first is "a composite mass or mixture" with allusions to cement and "hardened clay." The second is one that is arguably more accurate for present purposes, noting that a conglomerate is merely a "widely diversified corporation." |

|
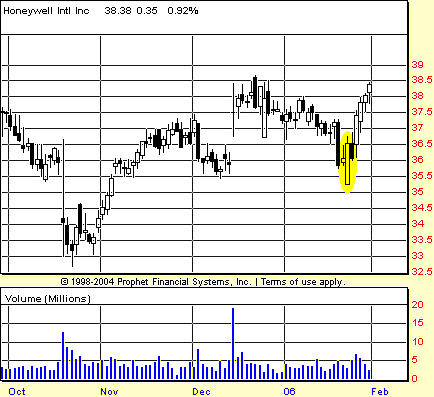
| FIGURE 1: HONEYWELL INTERNATIONAL, DAILY. A piercing pattern — an often reliable though infrequently appearing candlestick formation — reveals the strong shift in sentiment from fear to greed in shares of HON as a month-long decline ends in late January. |
| Graphic provided by: Prophet Financial, Inc. |
| |
| For many investors in conglomerates, the initial definition -- especially the reference to "hardening clay" -- typifies a long-held attitude toward the stocks of these megacorporate industrial giants. If it is true, as Jim Cramer of CNBC's Mad Money recently opined, that growth is "crack [cocaine]" to the stock market, then it is easy to see how companies that have already grown to Brobdingnagian proportions could come to be disdained by investors (dividends from those outsized corporations notwithstanding). |
| But if a stock that moves like "hardening clay" is bad, then a stock that collapses like a rockslide is far worse. And "rockslide" definitely describes the performance of conglomerates like General Electric, 3M, and Tyco -- three of the top five conglomerates in terms of market capitalization along with outperformers United Technologies and Honeywell International. |
So what is a stock like Honeywell International (HON) doing right? The most prominent technical feature in the HON chart continues to be the piercing pattern it created on January 24. The piercing pattern is a two-session candlestick pattern that can appear on any time frame in any tradable asset. Writing about piercing patterns -- or, as he refers to them, "piercing lines" -- in his book, Technical Analysis From A To Z, Steven B. Achelis notes that they are:A bullish pattern and the opposite of a dark cloud cover. The first line is a long black line and the second line is a long white line. The second line opens lower than the first line's low, but it closes more than halfway above the first line's real body. |
| The fact that HON is up nearly two points from the close of its piercing pattern session underscores the validity of the pattern. If there is any caution to be kept here, however, then that concern might stem from the fact that the piercing pattern developed on particularly light volume. Insofar as a piercing pattern reflects a shift in sentiment from fear to greed, the fact that such a shift occurred on lighter-than-average volume suggests that this shift might not be as significant as the subsequent bounce might make it seem. After all, the light volume appears to show that relatively few traders participated in this sentiment shift. Moreover, the fact that volume has contracted steadily since the piercing pattern, volume that is lower and lower as shares of HON move higher and higher, implies that more buyers are going to have to step up if HON's six-day reversal is to break to new highs just north of current levels. |
Technical Writer for Technical Analysis of STOCKS & COMMODITIES magazine, Working-Money.com, and Traders.com Advantage.
| Title: | Technical Writer |
| Company: | Technical Analysis, Inc. |
| Address: | 4757 California Avenue SW |
| Seattle, WA 98116 | |
| Phone # for sales: | 206 938 0570 |
| Fax: | 206 938 1307 |
| Website: | www.Traders.com |
| E-mail address: | DPenn@traders.com |
Traders' Resource Links | |
| Charting the Stock Market: The Wyckoff Method -- Books | |
| Working-Money.com -- Online Trading Services | |
| Traders.com Advantage -- Online Trading Services | |
| Technical Analysis of Stocks & Commodities -- Publications and Newsletters | |
| Working Money, at Working-Money.com -- Publications and Newsletters | |
| Traders.com Advantage -- Publications and Newsletters | |
| Professional Traders Starter Kit -- Software | |
Click here for more information about our publications!
Comments
Date: 01/31/06Rank: 3Comment:

Request Information From Our Sponsors
- StockCharts.com, Inc.
- Candle Patterns
- Candlestick Charting Explained
- Intermarket Technical Analysis
- John Murphy on Chart Analysis
- John Murphy's Chart Pattern Recognition
- John Murphy's Market Message
- MurphyExplainsMarketAnalysis-Intermarket Analysis
- MurphyExplainsMarketAnalysis-Visual Analysis
- StockCharts.com
- Technical Analysis of the Financial Markets
- The Visual Investor
- VectorVest, Inc.
- Executive Premier Workshop
- One-Day Options Course
- OptionsPro
- Retirement Income Workshop
- Sure-Fire Trading Systems (VectorVest, Inc.)
- Trading as a Business Workshop
- VectorVest 7 EOD
- VectorVest 7 RealTime/IntraDay
- VectorVest AutoTester
- VectorVest Educational Services
- VectorVest OnLine
- VectorVest Options Analyzer
- VectorVest ProGraphics v6.0
- VectorVest ProTrader 7
- VectorVest RealTime Derby Tool
- VectorVest Simulator
- VectorVest Variator
- VectorVest Watchdog
