HOT TOPICS LIST
- MACD
- Fibonacci
- RSI
- Gann
- ADXR
- Stochastics
- Volume
- Triangles
- Futures
- Cycles
- Volatility
- ZIGZAG
- MESA
- Retracement
- Aroon
INDICATORS LIST
LIST OF TOPICS
PRINT THIS ARTICLE
by Gary Grosschadl
This payroll and benefits outsourcing company looks ready to start an upleg.
Position: N/A
Gary Grosschadl
Independent Canadian equities trader and technical analyst based in Peterborough
Ontario, Canada.
PRINT THIS ARTICLE
CHART ANALYSIS
Paychex May Bounce
01/31/06 10:54:01 AMby Gary Grosschadl
This payroll and benefits outsourcing company looks ready to start an upleg.
Position: N/A
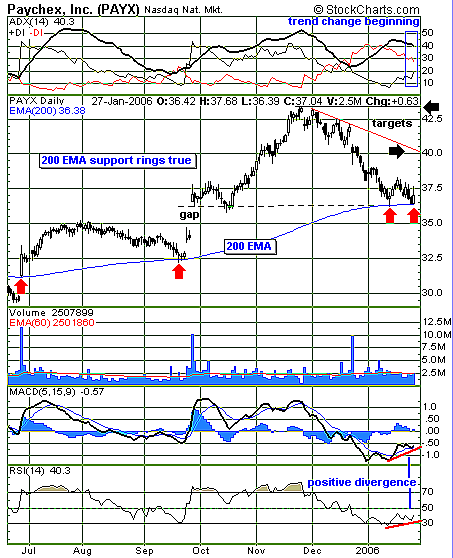
| After enduring a sizable correction from 43.50 to 36.50, Paychex, Inc., looks poised for future gains. What is striking on this daily chart (Figure 1) is the multiple support history offered by the stock's 200-day exponential moving average (EMA). This moving average often relates to significant support or resistance levels. Here we see four occasions where this moving average line was touched, halting previous declines. Several factors add to likely strong support at the current 200-day EMA of 36.88; this level lines up with a previous gap. These gap areas often hold future support. Note the candlestick formations for these last two "touches" of the 200-day EMA — one being a hammer-like candle with the long tail and Friday's bullish engulfing candlestick. Both formations hint at a possible bottom. |

|
| FIGURE 1: PAYCHEX, DAILY. This daily chart of PAYX shows good support from the 200-day EMA. |
| Graphic provided by: StockCharts.com. |
| |
| Several indicators also offer additional reasons for renewed bullishness. At the top of the chart, we have the markings of a possible trend change via the components of the directional movement indicator (DMI). When the average directional movement index (ADX) line peaks and reverses, this is a sign of a waning previous trend. In this case, the previous trend is a decline. In addition, the positive and negative directional indicators (DIs) are converging. Once +DI crosses above -DI, the bulls assume control over the bears. The graphs below the chart show positive divergences with the moving average convergence/divergence (MACD) and the relative strength index (RSI). As the stock touched a recent matching low, a higher low registered on those graphs, indicating a coming bullish price move. |
| Two targets are suggested: The first is resistance at a minor trendline that has a modest $40 target. Should the stock push past this zone with growing bullishness, the previous high-water mark of 43.50 becomes a future target. Should a surprise move south evolve below the 200-day EMA support, then $35 and 32.50 are likely support areas. |
Independent Canadian equities trader and technical analyst based in Peterborough
Ontario, Canada.
| Website: | www.whatsonsale.ca/financial.html |
| E-mail address: | gwg7@sympatico.ca |
Click here for more information about our publications!
Comments
Date: 01/31/06Rank: 5Comment:

Request Information From Our Sponsors
- StockCharts.com, Inc.
- Candle Patterns
- Candlestick Charting Explained
- Intermarket Technical Analysis
- John Murphy on Chart Analysis
- John Murphy's Chart Pattern Recognition
- John Murphy's Market Message
- MurphyExplainsMarketAnalysis-Intermarket Analysis
- MurphyExplainsMarketAnalysis-Visual Analysis
- StockCharts.com
- Technical Analysis of the Financial Markets
- The Visual Investor
- VectorVest, Inc.
- Executive Premier Workshop
- One-Day Options Course
- OptionsPro
- Retirement Income Workshop
- Sure-Fire Trading Systems (VectorVest, Inc.)
- Trading as a Business Workshop
- VectorVest 7 EOD
- VectorVest 7 RealTime/IntraDay
- VectorVest AutoTester
- VectorVest Educational Services
- VectorVest OnLine
- VectorVest Options Analyzer
- VectorVest ProGraphics v6.0
- VectorVest ProTrader 7
- VectorVest RealTime Derby Tool
- VectorVest Simulator
- VectorVest Variator
- VectorVest Watchdog
