HOT TOPICS LIST
- MACD
- Fibonacci
- RSI
- Gann
- ADXR
- Stochastics
- Volume
- Triangles
- Futures
- Cycles
- Volatility
- ZIGZAG
- MESA
- Retracement
- Aroon
INDICATORS LIST
LIST OF TOPICS
PRINT THIS ARTICLE
by Gary Grosschadl
This data management company was named by "Fortune" magazine as one of the "100 Best Companies to Work For" for the fourth consecutive year.
Position: Buy
Gary Grosschadl
Independent Canadian equities trader and technical analyst based in Peterborough
Ontario, Canada.
PRINT THIS ARTICLE
MOVING AVERAGES
Network Appliance Heats Up
01/30/06 08:29:51 AMby Gary Grosschadl
This data management company was named by "Fortune" magazine as one of the "100 Best Companies to Work For" for the fourth consecutive year.
Position: Buy
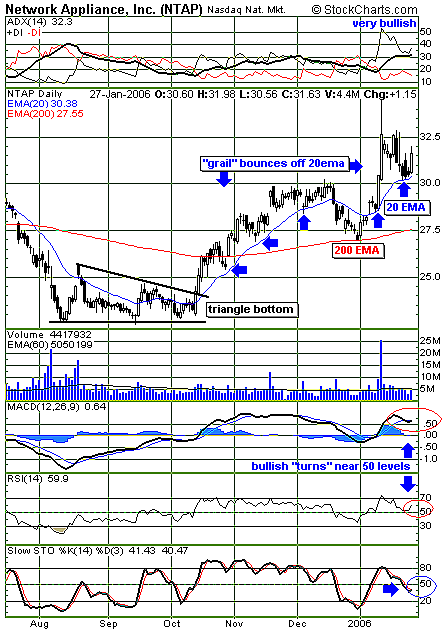
| Last autumn, Network Appliance Inc. formed a bottoming pattern via a descending triangle. This pattern was confirmed valid as the stock continued higher on this daily chart (Figure 1). Two moving averages helped define this rise. |
| Once a stock rises above its 200-period moving average, many traders consider that a trend change is under way, at least in that time frame. Here, we see how well the combination of the 20-day exponential moving average (EMA) and the 200-day EMA held support for the last four months. Once the 200-day EMA was breached, note how the rise was held intact by 20-day EMA support. A swing trading system called the "holy grail" (from the book StreetSmarts by Linda Rashke and Larry Connors) can be applied here. Basically, when a stock is enjoying a strong rise, it is often supported by this moving average. Buy signals are generated as the stock bounces off this moving average. Some traders consider the trend to be over when the stock closes below this MA. Note how the next upleg was launched by a bounce off the 200-day EMA. Now once again we see another "grail" move off the 20-day EMA appearing with Friday's close. |

|
| FIGURE 1: NETWORK APPLIANCE, DAILY. Here's a healthy uptrend after a bottoming pattern. |
| Graphic provided by: StockCharts.com. |
| |
| Several indicators also point to continued bullishness. The directional movement indicator at the top of the chart shows a strong uptrend in place via a rising average directional movement index (ADX) above 25. The lower indicators (moving average convergence/ divergence, relative strength index, and stochastics) all reflect a beginning upturn near their 50 levels. This often points to a bounce in the making. |
| Traders who are playing this latest grail move can elect to stay with this rise until the trend is broken with a close below the 20-day EMA. Mind you, a candlestick reversal pattern after an outlandish rise would also be a tempting sell point. Which will appear first? Only the market knows for sure. |
Independent Canadian equities trader and technical analyst based in Peterborough
Ontario, Canada.
| Website: | www.whatsonsale.ca/financial.html |
| E-mail address: | gwg7@sympatico.ca |
Click here for more information about our publications!
Comments
Date: 01/30/06Rank: 5Comment:

Request Information From Our Sponsors
- StockCharts.com, Inc.
- Candle Patterns
- Candlestick Charting Explained
- Intermarket Technical Analysis
- John Murphy on Chart Analysis
- John Murphy's Chart Pattern Recognition
- John Murphy's Market Message
- MurphyExplainsMarketAnalysis-Intermarket Analysis
- MurphyExplainsMarketAnalysis-Visual Analysis
- StockCharts.com
- Technical Analysis of the Financial Markets
- The Visual Investor
- VectorVest, Inc.
- Executive Premier Workshop
- One-Day Options Course
- OptionsPro
- Retirement Income Workshop
- Sure-Fire Trading Systems (VectorVest, Inc.)
- Trading as a Business Workshop
- VectorVest 7 EOD
- VectorVest 7 RealTime/IntraDay
- VectorVest AutoTester
- VectorVest Educational Services
- VectorVest OnLine
- VectorVest Options Analyzer
- VectorVest ProGraphics v6.0
- VectorVest ProTrader 7
- VectorVest RealTime Derby Tool
- VectorVest Simulator
- VectorVest Variator
- VectorVest Watchdog
