HOT TOPICS LIST
- MACD
- Fibonacci
- RSI
- Gann
- ADXR
- Stochastics
- Volume
- Triangles
- Futures
- Cycles
- Volatility
- ZIGZAG
- MESA
- Retracement
- Aroon
INDICATORS LIST
LIST OF TOPICS
PRINT THIS ARTICLE
by Gary Grosschadl
As Liberty Global Inc. breaks important support, downside targets are being considered for this NASDAQ 100 company.
Position: Sell
Gary Grosschadl
Independent Canadian equities trader and technical analyst based in Peterborough
Ontario, Canada.
PRINT THIS ARTICLE
CHANNEL LINES
Liberty Global May Tumble Lower
01/30/06 08:11:56 AMby Gary Grosschadl
As Liberty Global Inc. breaks important support, downside targets are being considered for this NASDAQ 100 company.
Position: Sell
| Liberty Global is one of the largest cable television operators outside the United States, principally in Europe, Asia, and Latin America. |
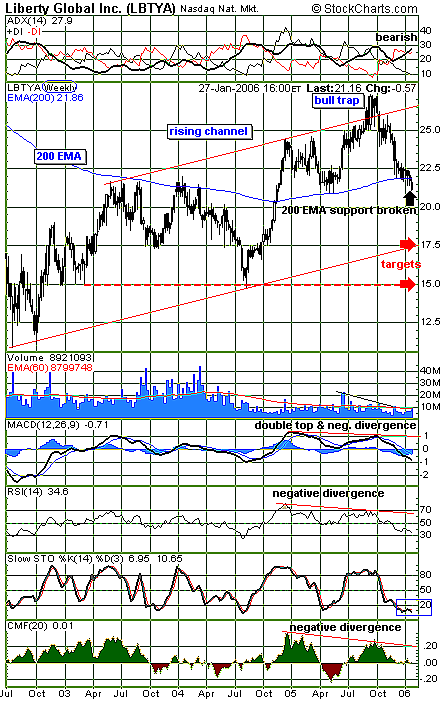
| Figure 1 shows a rising channel that is considered to be a bullish continuation pattern. Prices tend to move along the channel until the trend is broken, and this weekly chart illustrates the danger of assuming a trend change on a sudden trendline break. In this case, some bulls were trapped as the move reversed back inside the pattern. A more prudent and safer strategy would be to buy on a bounce off the support line, currently at 17.5. |

|
| FIGURE 1: LIBERTY GLOBAL, WEEKLY. Here's a support break in the middle of a pattern. |
| Graphic provided by: StockCharts.com. |
| |
| Several indicators also show reason to doubt the breakout attempt. The volume on the break was not convincing as, ideally, it should be noticeably larger. In addition, several indicators below the chart show negative divergences to price action. Downlegs often appear when such indicators diverge from price action. The moving average convergence/divergence (MACD), the relative strength index (RSI), and the Chaikin money flow (MFI) all show this divergent action. |
| Note the current support break of the ever-important 200-period exponential moving average (EMA). As this line has a history of "respect," further downside is likely. Two downside targets are indicated: 17.5 is a possible channel support, and failing that, the previous support level of 15. A bounce at either of these levels would draw bulls in. The lower target could come into play as a "spring" setup. As the top limit sprang outside the channel, a similar occurrence could be reflected at the bottom channel. |
Independent Canadian equities trader and technical analyst based in Peterborough
Ontario, Canada.
| Website: | www.whatsonsale.ca/financial.html |
| E-mail address: | gwg7@sympatico.ca |
Click here for more information about our publications!
Comments
Date: 01/30/06Rank: 5Comment:

Request Information From Our Sponsors
- StockCharts.com, Inc.
- Candle Patterns
- Candlestick Charting Explained
- Intermarket Technical Analysis
- John Murphy on Chart Analysis
- John Murphy's Chart Pattern Recognition
- John Murphy's Market Message
- MurphyExplainsMarketAnalysis-Intermarket Analysis
- MurphyExplainsMarketAnalysis-Visual Analysis
- StockCharts.com
- Technical Analysis of the Financial Markets
- The Visual Investor
- VectorVest, Inc.
- Executive Premier Workshop
- One-Day Options Course
- OptionsPro
- Retirement Income Workshop
- Sure-Fire Trading Systems (VectorVest, Inc.)
- Trading as a Business Workshop
- VectorVest 7 EOD
- VectorVest 7 RealTime/IntraDay
- VectorVest AutoTester
- VectorVest Educational Services
- VectorVest OnLine
- VectorVest Options Analyzer
- VectorVest ProGraphics v6.0
- VectorVest ProTrader 7
- VectorVest RealTime Derby Tool
- VectorVest Simulator
- VectorVest Variator
- VectorVest Watchdog
