HOT TOPICS LIST
- MACD
- Fibonacci
- RSI
- Gann
- ADXR
- Stochastics
- Volume
- Triangles
- Futures
- Cycles
- Volatility
- ZIGZAG
- MESA
- Retracement
- Aroon
INDICATORS LIST
LIST OF TOPICS
PRINT THIS ARTICLE
by David Penn
Negative divergences in the MACD histogram and stochastics augur a change in course for March cocoa's nearly two-month advance.
Position: N/A
David Penn
Technical Writer for Technical Analysis of STOCKS & COMMODITIES magazine, Working-Money.com, and Traders.com Advantage.
PRINT THIS ARTICLE
REVERSAL
The Cocoa Correction Cometh
01/30/06 07:47:36 AMby David Penn
Negative divergences in the MACD histogram and stochastics augur a change in course for March cocoa's nearly two-month advance.
Position: N/A
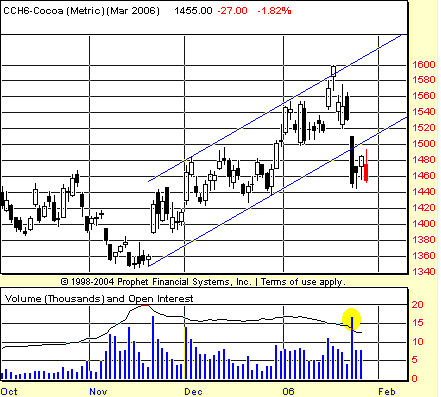
| If breaking a trendline is never a good sign for a trend, then what would you call breaking a trendline, with a gap down at the open on volume that is nearly a contract high? How about: "Time to sell"? |

|
| FIGURE 1: MARCH COCOA FUTURES, DAILY. A trendline break on big volume signals the end of March cocoa's autumn rally. Note how prices have found some measure of support in the area of the lows from the second half of December. |
| Graphic provided by: Prophet Financial, Inc. |
| |
| Ironically enough, the only time in the history of the March 2006 cocoa futures contract that volume was higher than it was on January 24, 2006, was the volume on November 18, 2005. November 18, as Figure 1 shows, was the session during which the advance in March cocoa (also known as CCH6) truly got under way. That mid-November session saw a gap up of several points at the open, as a rush of buyers determined that cocoa prices had fallen far enough and begun to bid the commodity higher. In some ways, the trendline-breaking candlestick in January is the inverse or mirror image of the candlestick that began CCH6's autumn rally approximately two months before. |
| It appears as if the breakdown in March cocoa has run into at least temporary support at the 1460-1440 level. This support likely comes from two sources — one practical, the other somewhat mystical. The practical source of support stems from the lows made in the second half of December, lows that saw CCH6 dip as low as 1430 or so on an intrasession basis. The more "mystical" source of support comes from the fact that at this point, the decline in March cocoa has retraced a Fibonacci level of 61.8% and is, for the time being, finding just enough willing buyers to prevent cocoa from falling further. |

|
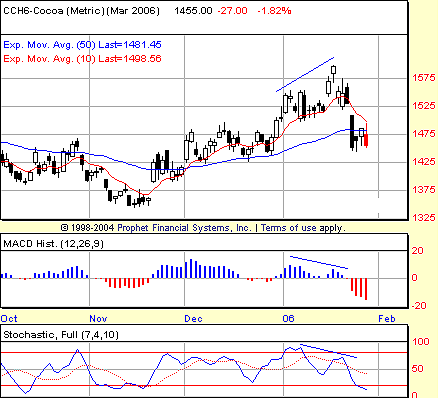
| FIGURE 2: MARCH COCOA FUTURES, DAILY. A negative divergence in the MACD histogram and in the stochastic was a powerful warning that upside momentum was waning in March cocoa. The stochastic, in particular, turned down to create the confirming negative divergence on January 23 — one day before the trendline-breaking gap down session. |
| Graphic provided by: Prophet Financial, Inc. |
| |
| Is there any way that traders could have anticipated so sharp a break? After all, a cocoa trader who was long March cocoa at the close of trading on January 23 — when cocoa was still well within its trend channel — woke up the next morning to find cocoa opening 25 points (and $250) lower. And had this unlucky trader stuck around in hopes of a turnaround — and let's not pretend that none of us have ever made THAT mistake — that $250 loser at the open would have swelled into a 79-point ($790) megaloser. |
| Fortunately, March cocoa tipped its bearish (or at least, vulnerable to correction) hand the day before its sharp drop on January 24. The tell was the pair of negative divergences — one in the moving average convergence/divergence (MACD) histogram and one in the stochastic completed on January 23 (Figure 2). While the negative divergence in the stochastic is often warning enough, the fact that it was confirmed by a similarly negative divergence in the MACD histogram was truly a wake-up call to those bulls that perhaps had become complacent with a market that had run from a low of 1360 to a high of 1600 in approximately two months. |
Technical Writer for Technical Analysis of STOCKS & COMMODITIES magazine, Working-Money.com, and Traders.com Advantage.
| Title: | Technical Writer |
| Company: | Technical Analysis, Inc. |
| Address: | 4757 California Avenue SW |
| Seattle, WA 98116 | |
| Phone # for sales: | 206 938 0570 |
| Fax: | 206 938 1307 |
| Website: | www.Traders.com |
| E-mail address: | DPenn@traders.com |
Traders' Resource Links | |
| Charting the Stock Market: The Wyckoff Method -- Books | |
| Working-Money.com -- Online Trading Services | |
| Traders.com Advantage -- Online Trading Services | |
| Technical Analysis of Stocks & Commodities -- Publications and Newsletters | |
| Working Money, at Working-Money.com -- Publications and Newsletters | |
| Traders.com Advantage -- Publications and Newsletters | |
| Professional Traders Starter Kit -- Software | |
Click here for more information about our publications!
Comments
Date: 01/30/06Rank: 2Comment:

Request Information From Our Sponsors
- StockCharts.com, Inc.
- Candle Patterns
- Candlestick Charting Explained
- Intermarket Technical Analysis
- John Murphy on Chart Analysis
- John Murphy's Chart Pattern Recognition
- John Murphy's Market Message
- MurphyExplainsMarketAnalysis-Intermarket Analysis
- MurphyExplainsMarketAnalysis-Visual Analysis
- StockCharts.com
- Technical Analysis of the Financial Markets
- The Visual Investor
- VectorVest, Inc.
- Executive Premier Workshop
- One-Day Options Course
- OptionsPro
- Retirement Income Workshop
- Sure-Fire Trading Systems (VectorVest, Inc.)
- Trading as a Business Workshop
- VectorVest 7 EOD
- VectorVest 7 RealTime/IntraDay
- VectorVest AutoTester
- VectorVest Educational Services
- VectorVest OnLine
- VectorVest Options Analyzer
- VectorVest ProGraphics v6.0
- VectorVest ProTrader 7
- VectorVest RealTime Derby Tool
- VectorVest Simulator
- VectorVest Variator
- VectorVest Watchdog
