HOT TOPICS LIST
- MACD
- Fibonacci
- RSI
- Gann
- ADXR
- Stochastics
- Volume
- Triangles
- Futures
- Cycles
- Volatility
- ZIGZAG
- MESA
- Retracement
- Aroon
INDICATORS LIST
LIST OF TOPICS
PRINT THIS ARTICLE
by David Penn
January came in like a lion. Does an intraday reversal pattern anticipate that January will go out like a lion as well?
Position: N/A
David Penn
Technical Writer for Technical Analysis of STOCKS & COMMODITIES magazine, Working-Money.com, and Traders.com Advantage.
PRINT THIS ARTICLE
THE DIAMOND
An Intraday Dow Diamond
01/27/06 07:41:27 AMby David Penn
January came in like a lion. Does an intraday reversal pattern anticipate that January will go out like a lion as well?
Position: N/A
| I've found myself writing about consolidations lately (most recently, "Caterpillar's Diamond Breakout," Traders.com Advantage; January 26, 2006), which is a testament to the condition the markets have found themselves in since the opening week of January sent stocks on a tear to the upside. |

|
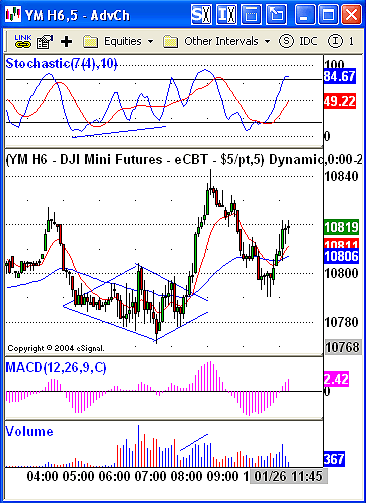
| FIGURE 1: MARCH EMINI DOW FUTURES, FIVE-MINUTE. Technical indicators can help traders anticipate breakouts from otherwise directionless consolidation patterns. Note how a running positive divergence in the stochastic suggested that the breakout from the diamond consolidation of January 26 would be upward. Appropriately enough, volume expanded on the breakout as well. |
| Graphic provided by: eSignal. |
| |
| In the article about Caterpillar's diamond, I pointed out how a negative stochastic divergence within the pattern hinted that the break from the pattern was likely to be downward. What was important, though, was the fact that although there was a negative stochastic divergence that set up the trade, the necessary follow-through to the downside was completely absent. I should add that sometimes when signals in one direction prove unfulfilled, it is a "heads-up" alert that the market might move in the opposite direction — that is to say, a negative divergence that goes unfulfilled or unconfirmed with downside follow-through is often a bullish development. |
| That was not the case here with the intraday diamond in the March emini Dow futures (YMH6) the morning of January 26. As Figure 1 shows, there was a running positive stochastic divergence that began with the stochastic low around 4:30 am Pacific time. As the YMH6 chopped forward with a downward bias, the stochastic continued to make higher lows — near 6:30 am and then again around 7:00 am. That higher low in the stochastic at 7:00 am came just as YMH6 was making still yet another lower low. And it was that low that would serve as the launching pad for the market's sharp, sudden move higher in the eight and nine o'clock hours. |
| The measurement rule for diamonds takes the size of the pattern at its widest point, and adds that amount to the value at the breakout level. In this case, a pattern size of 33 is added to a breakout level value at about 10790 for a minimum upside projection of 10823. This minimum upside was reached a little over 15 minutes after the breakout. The March emini Dow actually continued higher by half as much, tacking on an additional 20-odd points before topping with a shooting star candlestick and rolling over and down. Interestingly, as sharp as the post-breakout, post-minimum price objective correction was, that correction stopped and found support at the exact same level as the breakout — 10790 to the penny. |
Technical Writer for Technical Analysis of STOCKS & COMMODITIES magazine, Working-Money.com, and Traders.com Advantage.
| Title: | Technical Writer |
| Company: | Technical Analysis, Inc. |
| Address: | 4757 California Avenue SW |
| Seattle, WA 98116 | |
| Phone # for sales: | 206 938 0570 |
| Fax: | 206 938 1307 |
| Website: | www.Traders.com |
| E-mail address: | DPenn@traders.com |
Traders' Resource Links | |
| Charting the Stock Market: The Wyckoff Method -- Books | |
| Working-Money.com -- Online Trading Services | |
| Traders.com Advantage -- Online Trading Services | |
| Technical Analysis of Stocks & Commodities -- Publications and Newsletters | |
| Working Money, at Working-Money.com -- Publications and Newsletters | |
| Traders.com Advantage -- Publications and Newsletters | |
| Professional Traders Starter Kit -- Software | |
Click here for more information about our publications!
Comments
Date: 01/28/06Rank: 2Comment:
Date: 02/01/06Rank: 3Comment:

Request Information From Our Sponsors
- VectorVest, Inc.
- Executive Premier Workshop
- One-Day Options Course
- OptionsPro
- Retirement Income Workshop
- Sure-Fire Trading Systems (VectorVest, Inc.)
- Trading as a Business Workshop
- VectorVest 7 EOD
- VectorVest 7 RealTime/IntraDay
- VectorVest AutoTester
- VectorVest Educational Services
- VectorVest OnLine
- VectorVest Options Analyzer
- VectorVest ProGraphics v6.0
- VectorVest ProTrader 7
- VectorVest RealTime Derby Tool
- VectorVest Simulator
- VectorVest Variator
- VectorVest Watchdog
- StockCharts.com, Inc.
- Candle Patterns
- Candlestick Charting Explained
- Intermarket Technical Analysis
- John Murphy on Chart Analysis
- John Murphy's Chart Pattern Recognition
- John Murphy's Market Message
- MurphyExplainsMarketAnalysis-Intermarket Analysis
- MurphyExplainsMarketAnalysis-Visual Analysis
- StockCharts.com
- Technical Analysis of the Financial Markets
- The Visual Investor
