

HOT TOPICS LIST
- MACD
- Fibonacci
- RSI
- Gann
- ADXR
- Stochastics
- Volume
- Triangles
- Futures
- Cycles
- Volatility
- ZIGZAG
- MESA
- Retracement
- Aroon
INDICATORS LIST
LIST OF TOPICS
PRINT THIS ARTICLE
by Richard Thomas Canfield
Here's a look at the relationship between three advance/decline price metrics.
Position: N/A
Richard Thomas Canfield
Retired engineer, former CEO, now trading futures.
PRINT THIS ARTICLE
A/D RATIO
Metrics Presage Price Trend Reversal
01/26/06 08:14:31 AMby Richard Thomas Canfield
Here's a look at the relationship between three advance/decline price metrics.
Position: N/A
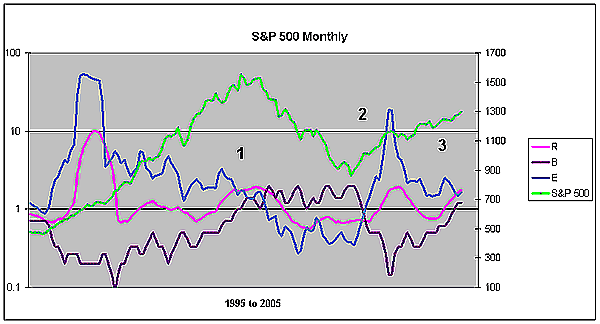
| Figure 1, which shows the monthly close for the Standard & Poor's 500, serves to explain how three price metrics provide price predictability: ratio (R), breakeven (B), and expectancy (E). These metrics that are all derivations of the frequency and size of price advances. I will show how metric interactions in certain patterns foreshadow price changes in any stock or commodity. Line R shows the advance to decline ratio. Line B, which shows the percent of declines/percent of advances, is the hurdle that line R must exceed for a positive trend. And line E — that is, the average advance multiplied by percent of advances/average decline multiplied by percent of declines — is a quantitative forecast for the price trend. |
| Because these three metrics are derived from the current historical record, they are never wrong. Next, we will look at two reliable chart patterns that presage reverses in price trend, but before we do so, let's keep this in mind. The value of 1.00 (left scale) is a crucial barrier. When line B is below 1.00 with lines R and E above 1.00, the price trend will be positive. The converse relationship correlates to a negative trend. Remember, price is governed by, and must follow, the frequency and size of price advances. Knowing the relative positions and slopes of the governing metrics gives us price predictability. Examine the 12-month moving average metric patterns on Figure 1 and see what the metrics can tell us. |
|
| FIGURE 1: S&P 500, MONTHLY |
| Graphic provided by: Microsoft Excel. |
| |
| Position 1 shows a change-to-negative trend pattern; line E is declining to cross through line R, while line B is advancing up through 1.00. The pattern is completed when E and R both cross line B and continue to cross down through 1.00 with strong momentum. This pattern presages the long decline in the S&P 500. Position 3 shows this same pattern developing at the warning point that will be actionable when it is apparent line E will cross down through 1.00. Position 2 shows a change-to-positive trend pattern; E is crossing up through 1.00 simultaneously, with B crossing down giving a strong alert, and then R crosses B, proceeding up through 1.00 to confirm the new trend. Metrics on a steep slope, crossing 1.00 from far above or below, indicates strong momentum foretelling a major price trend to follow. There are other clues to warn what may happen at position 3; these are left for you to find by examining the pattern at position 1. |
Retired engineer, former CEO, now trading futures.
Click here for more information about our publications!
Comments
Date:�01/28/06Rank:�2Comment:�
Date:�02/01/06Rank:�2Comment:�

Request Information From Our Sponsors
- StockCharts.com, Inc.
- Candle Patterns
- Candlestick Charting Explained
- Intermarket Technical Analysis
- John Murphy on Chart Analysis
- John Murphy's Chart Pattern Recognition
- John Murphy's Market Message
- MurphyExplainsMarketAnalysis-Intermarket Analysis
- MurphyExplainsMarketAnalysis-Visual Analysis
- StockCharts.com
- Technical Analysis of the Financial Markets
- The Visual Investor
- VectorVest, Inc.
- Executive Premier Workshop
- One-Day Options Course
- OptionsPro
- Retirement Income Workshop
- Sure-Fire Trading Systems (VectorVest, Inc.)
- Trading as a Business Workshop
- VectorVest 7 EOD
- VectorVest 7 RealTime/IntraDay
- VectorVest AutoTester
- VectorVest Educational Services
- VectorVest OnLine
- VectorVest Options Analyzer
- VectorVest ProGraphics v6.0
- VectorVest ProTrader 7
- VectorVest RealTime Derby Tool
- VectorVest Simulator
- VectorVest Variator
- VectorVest Watchdog