HOT TOPICS LIST
- MACD
- Fibonacci
- RSI
- Gann
- ADXR
- Stochastics
- Volume
- Triangles
- Futures
- Cycles
- Volatility
- ZIGZAG
- MESA
- Retracement
- Aroon
INDICATORS LIST
LIST OF TOPICS
PRINT THIS ARTICLE
by David Penn
A December diamond consolidation leads to higher prices in January.
Position: N/A
David Penn
Technical Writer for Technical Analysis of STOCKS & COMMODITIES magazine, Working-Money.com, and Traders.com Advantage.
PRINT THIS ARTICLE
THE DIAMOND
Caterpillar's Diamond Breakout
01/26/06 07:51:10 AMby David Penn
A December diamond consolidation leads to higher prices in January.
Position: N/A
| Welcome to another edition of "Consolidations in trends"! If ever there is a time to practice a trader's greatest skill (that is, patience), then the appearance of a consolidation after a strong trend might be that opportunity. Often, especially with stocks, traders will come upon a market after it has already made a good move to the upside or the downside. Sometimes, a trader will end up with a failed or scratched trade or two before he or she concludes that the market is not going to move appreciably for the time being. That "time being" is often the first few sessions of a consolidating market. |

|
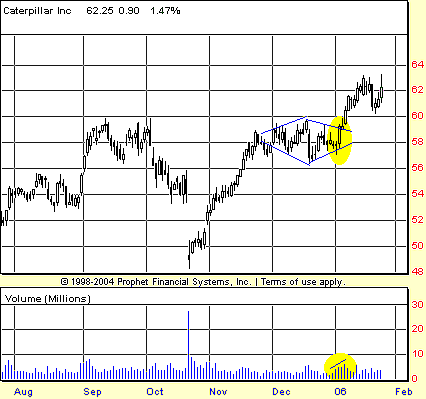
| FIGURE 1: CATERPILLAR, DAILY. A diamond consolidation in December leads to a breakout in early January. Note the increase in volume from the final days of December to the first few days of January. |
| Graphic provided by: Prophet Financial, Inc. |
| |
| Consolidations don't always take specific forms. More often than not, consolidations are rectangular, reflecting a market caught between fierce resistance above and stalwart support below. Other times, consolidations can be directional. This is the case in consolidations like ascending and descending triangles, rising and falling wedges, bullish and bearish flags, and pennants. Other times, consolidations are neither rectangular nor directional. This category includes both symmetrical triangles and what could be called the "double symmetrical triangle" — though it makes more sense simply to refer to them as "diamonds" (Figure 1). |
| I've written quite a bit about diamond patterns for Traders.com Advantage over the years. I called them "double symmetrical triangles" a paragraph ago because that is one easy way to conceptualize them: a pair of converging trendines to the left and a pair of converging trendlines to the right. When scanning for diamonds, I tend to be on the lookout for sharp rallies followed immediately by sharp declines. This "switchback" movement often occurs at the center of a diamond consolidation, marking the high and low points of the pattern. |

|
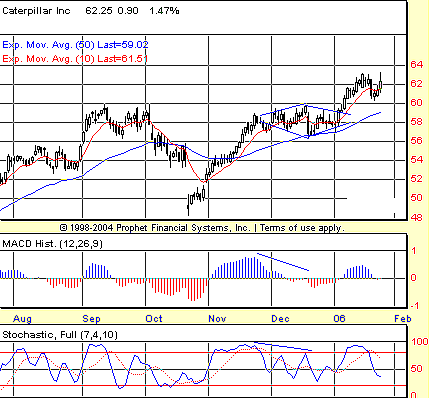
| FIGURE 2: CATERPILLAR, DAILY. Negative divergences in the stochastic and the MACD histogram suggested that the December diamond consolidation might be a top. However, the lack of downside follow-through helps keep traders from making the mistake of betting against CAT in mid-December. |
| Graphic provided by: Prophet Financial, Inc. |
| |
| The center of the diamond consolidation, generally the widest point of the pattern, is also key in determining the minimum extent of any breakout or breakdown. Simply by adding the distance between the high and low points of the pattern to the value at the breakout/down point, traders can get a reasonable upside minimum target. In the case of Caterpillar, adding approximately four points to the breakout level of 58 provides for an upside of 62. Note in Figure 2 that it was just after reaching 62 that shares of Caterpillar began running low on upside momentum. At the same time, note how the pullback in mid-January found support — for now — at the top of the diamond pattern at 60. |
| Like symmetrical triangles, one of the most vexing things about diamond consolidations is that while consolidations in trends tend to be resolved with further movement in the direction of the previous trend, that is not always the case (see my "From Consolidation To Top," January 20, 2006; Traders.com Advantage). One of the ways that traders can try and anticipate the direction of breakouts/downs from nondirectional chart patterns is by studying technical divergences. With CAT, there were negative divergences in both the moving average convergence/divergence (MACD) histogram and stochastic. This is often a good sign that the market in question will head lower, if the requisite downside follow-through is present. That was not the case with Caterpillar in December. The day the stochastic made its lower high ("made" by turning down) saw a strong bout of selling. However, there was no follow-through below that day whatsoever. The low of that selling day marked the low of the formation. And with the portents of the negative divergence no longer applicable, traders could regain hope that this consolidation in a trend would lead to "more trend." |
Technical Writer for Technical Analysis of STOCKS & COMMODITIES magazine, Working-Money.com, and Traders.com Advantage.
| Title: | Technical Writer |
| Company: | Technical Analysis, Inc. |
| Address: | 4757 California Avenue SW |
| Seattle, WA 98116 | |
| Phone # for sales: | 206 938 0570 |
| Fax: | 206 938 1307 |
| Website: | www.Traders.com |
| E-mail address: | DPenn@traders.com |
Traders' Resource Links | |
| Charting the Stock Market: The Wyckoff Method -- Books | |
| Working-Money.com -- Online Trading Services | |
| Traders.com Advantage -- Online Trading Services | |
| Technical Analysis of Stocks & Commodities -- Publications and Newsletters | |
| Working Money, at Working-Money.com -- Publications and Newsletters | |
| Traders.com Advantage -- Publications and Newsletters | |
| Professional Traders Starter Kit -- Software | |
Click here for more information about our publications!
Comments
Date: 01/28/06Rank: 3Comment:

|

Request Information From Our Sponsors
- StockCharts.com, Inc.
- Candle Patterns
- Candlestick Charting Explained
- Intermarket Technical Analysis
- John Murphy on Chart Analysis
- John Murphy's Chart Pattern Recognition
- John Murphy's Market Message
- MurphyExplainsMarketAnalysis-Intermarket Analysis
- MurphyExplainsMarketAnalysis-Visual Analysis
- StockCharts.com
- Technical Analysis of the Financial Markets
- The Visual Investor
- VectorVest, Inc.
- Executive Premier Workshop
- One-Day Options Course
- OptionsPro
- Retirement Income Workshop
- Sure-Fire Trading Systems (VectorVest, Inc.)
- Trading as a Business Workshop
- VectorVest 7 EOD
- VectorVest 7 RealTime/IntraDay
- VectorVest AutoTester
- VectorVest Educational Services
- VectorVest OnLine
- VectorVest Options Analyzer
- VectorVest ProGraphics v6.0
- VectorVest ProTrader 7
- VectorVest RealTime Derby Tool
- VectorVest Simulator
- VectorVest Variator
- VectorVest Watchdog
