HOT TOPICS LIST
- MACD
- Fibonacci
- RSI
- Gann
- ADXR
- Stochastics
- Volume
- Triangles
- Futures
- Cycles
- Volatility
- ZIGZAG
- MESA
- Retracement
- Aroon
INDICATORS LIST
LIST OF TOPICS
PRINT THIS ARTICLE
by Koos van der Merwe
The belief that the price of gold has been moving inversely to the US dollar is now a wrong belief. Why?
Position: Accumulate
Koos van der Merwe
Has been a technical analyst since 1969, and has worked as a futures and options trader with First Financial Futures in Johannesburg, South Africa.
PRINT THIS ARTICLE
CORRELATION ANALYSIS
Gold To Currencies
01/25/06 01:08:59 PMby Koos van der Merwe
The belief that the price of gold has been moving inversely to the US dollar is now a wrong belief. Why?
Position: Accumulate
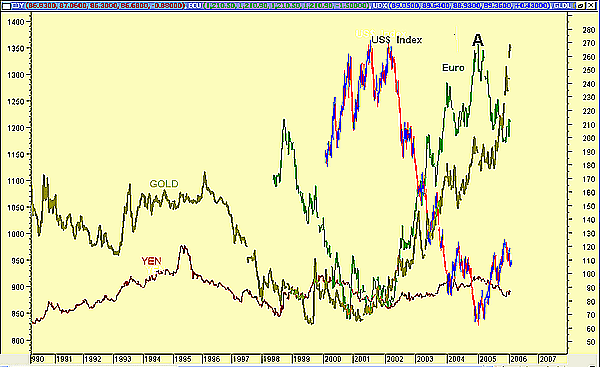
| Figure 1 shows the various currencies as they moved relative to the US Dollar Index. I have shown the movements of the US dollar, the euro, and the yen. See how both the euro and the yen made lows in 2001 while the US Dollar Index made highs, and as the US Dollar Index fell, both the euro and the yen rose, with the dollar reaching a low at point A and the euro and the yen reaching a high. Since then, the US dollar has risen and both the euro and yen have fallen. I also plotted the London gold price. Note how closely it tracked the movement of the yen and then the euro as data appeared. Note too how gold acted inversely to the US Dollar Index, rising from 2001 as the US Dollar Index fell. However, at point A, things changed. At that point on the chart, gold started moving with the US dollar. As the US Dollar Index strengthened, gold did as well, but the euro and the yen continued to weaken. |

|
| FIGURE 1: GOLD AND THE CURRENCIES. Why did gold suddenly start moving with the US dollar? |
| Graphic provided by: MetaStock. |
| |
| Why? Why did gold suddenly start moving with the US Dollar Index? I believe it is because of uncertainty in Iran. The following article appeared in the Christian Science Monitor on May 25, 2005: Iran's elections cast a shadow on nuclear talks |
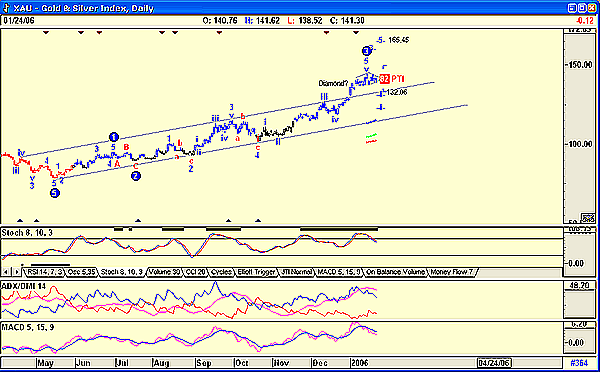
| On June 17, 2005, a conservative Muslim government more in tune with the religious authority of the ruling body was elected and that the president, Mahmud Ahmadinejad, affirmed Iran's right to pursue peaceful nuclear activities, saying the activities were in line with international law and regulations, particularly the nuclear Non-Proliferation Treaty (NPT). The world became fearful. Could Iran be trusted? We have only to look at the movement of gold for that answer. Gold started moving with the US Dollar Index. It appears to have become a safe haven for investors against a possible nuclear threat by Iran. This past weekend, Israel mentioned that it was considering taking action against Iran. Of course, the world looks to a preemptive strike similar to the one Israel conducted against the nuclear development facilities in Iraq during the Saddam Hussein regime, but Israel has not spelled out exactly what action it will take. With Prime Minister Ariel Sharon in a coma and an election due next month, speculation is rife. So how high can gold move? The charts are suggesting a short-term correction after gold's recent strong move, but then, the next resistance level is $611. Once this is broken — and it could be over the next few years and not months — gold could well test its all-time high of $800 per ounce, if not exceed it. Figure 2 is a chart of the Philadelphia Gold and Silver Index, which shows what appears to be a diamond formation developing — a negative. This, along with the stochastic oscillator, the downturn of the average directional movement index/directional movement index and a sell signal of the moving average convergence/divergence (MACD), does suggest a short-term correction. |

|
| FIGURE 2: GOLD AND SILVER INDEX. Could gold have started moving with the US dollar as a safe haven? |
| Graphic provided by: AdvancedGET. |
| |
| However, Figure 2 also shows an Elliott wave count, with wave 3 being completed or about to be completed. This will be followed by a wave 4 correction down to the 132 level, and then a wave 5 up to the 165 level, an increase of 17% from present levels. The probability index is also suggesting a figure of 82% for this scenario. So do your research, but do not buy yet. Wait for the correction first, and only then buy. |
Has been a technical analyst since 1969, and has worked as a futures and options trader with First Financial Futures in Johannesburg, South Africa.
| Address: | 3256 West 24th Ave |
| Vancouver, BC | |
| Phone # for sales: | 6042634214 |
| E-mail address: | petroosp@gmail.com |
Click here for more information about our publications!
Comments
Date: 01/28/06Rank: 2Comment:

|

Request Information From Our Sponsors
- StockCharts.com, Inc.
- Candle Patterns
- Candlestick Charting Explained
- Intermarket Technical Analysis
- John Murphy on Chart Analysis
- John Murphy's Chart Pattern Recognition
- John Murphy's Market Message
- MurphyExplainsMarketAnalysis-Intermarket Analysis
- MurphyExplainsMarketAnalysis-Visual Analysis
- StockCharts.com
- Technical Analysis of the Financial Markets
- The Visual Investor
- VectorVest, Inc.
- Executive Premier Workshop
- One-Day Options Course
- OptionsPro
- Retirement Income Workshop
- Sure-Fire Trading Systems (VectorVest, Inc.)
- Trading as a Business Workshop
- VectorVest 7 EOD
- VectorVest 7 RealTime/IntraDay
- VectorVest AutoTester
- VectorVest Educational Services
- VectorVest OnLine
- VectorVest Options Analyzer
- VectorVest ProGraphics v6.0
- VectorVest ProTrader 7
- VectorVest RealTime Derby Tool
- VectorVest Simulator
- VectorVest Variator
- VectorVest Watchdog
