HOT TOPICS LIST
- MACD
- Fibonacci
- RSI
- Gann
- ADXR
- Stochastics
- Volume
- Triangles
- Futures
- Cycles
- Volatility
- ZIGZAG
- MESA
- Retracement
- Aroon
INDICATORS LIST
LIST OF TOPICS
PRINT THIS ARTICLE
by Arthur Hill
The Xilinx bulls had a lot going last week, but a failed breakout and gap down set a classic bull trap.
Position: Sell
Arthur Hill
Arthur Hill is currently editor of TDTrader.com, a website specializing in trading strategies, sector/industry specific breadth stats and overall technical analysis. He passed the Society of Technical Analysts (STA London) diploma exam with distinction is a Certified Financial Technician (CFTe). Prior to TD Trader, he was the Chief Technical Analyst for Stockcharts.com and the main contributor to the ChartSchool.
PRINT THIS ARTICLE
STOCHASTIC OSCILL
A Bull Trap For Xilinx
01/25/06 08:20:43 AMby Arthur Hill
The Xilinx bulls had a lot going last week, but a failed breakout and gap down set a classic bull trap.
Position: Sell
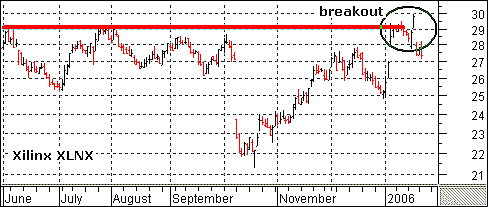
| Xilinx (XLNX) has been all over the board the last few months. The stock gapped down in October and then recouped that loss in November. The stock corrected slightly in December and then broke resistance in January 2006. There was even a gap higher in early January and an eight-month high last week. It looked as if XLNX was off to the races before a disappointing earnings report sent the stock sharply lower (Figure 1). The result was a bull trap and short-term bearish reversal. |

|
| FIGURE 1: XLNX. The gap higher made the stock look like it was off and running, but such was not the case. |
| Graphic provided by: MetaStock. |
| Graphic provided by: MS QuoteCenter. |
| |
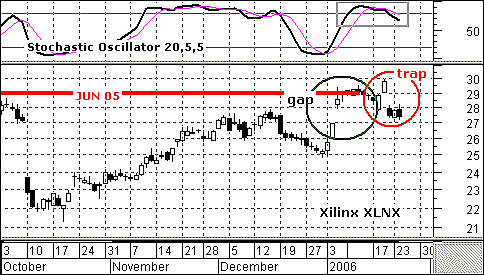
| Last week's surge and close above 29.5 looked like a bullish breakout, but the breakout did not hold for even one day. There are no steadfast rules for breakouts and moving average crossovers, but many traders apply a three-day rule. This means that a breakout or crossover needs to hold for at least three days to be considered valid. XLNX did not hold the breakout for more than a day and in fact gapped below 29 the very next day. Those buying on the breakout were trapped and left holding the bag (Figure 2). |

|
| FIGURE 2: XLNX. The breakout did not even hold for a day, revealing a bull trap. |
| Graphic provided by: MetaStock. |
| Graphic provided by: MS QuoteCenter. |
| |
| In addition to the three-day rule, traders could have also turned to the stochastic oscillator for guidance. This indicator became overbought the second week of January. An overbought indication should not be considered bearish and this was not enough to foreshadow such a sudden reversal. However, the overbought nature of the indicator suggested that further upside would be limited. |
| What now for Xilinx? The short-term evidence is bearish and points to lower prices. First, the stochastic oscillator rolled and moved below 80. Second, the breakout at 29 failed to hold, showing a lack of resolve among the bulls. Third, the stock gapped lower and has yet to recover. This gap should be considered bearish as long as it remains unfilled. A move back above 29 would fill the gap and put the upside breakout back in play. |
Arthur Hill is currently editor of TDTrader.com, a website specializing in trading strategies, sector/industry specific breadth stats and overall technical analysis. He passed the Society of Technical Analysts (STA London) diploma exam with distinction is a Certified Financial Technician (CFTe). Prior to TD Trader, he was the Chief Technical Analyst for Stockcharts.com and the main contributor to the ChartSchool.
| Title: | Editor |
| Company: | TDTrader.com |
| Address: | Willem Geetsstraat 17 |
| Mechelen, B2800 | |
| Phone # for sales: | 3215345465 |
| Website: | www.tdtrader.com |
| E-mail address: | arthurh@tdtrader.com |
Traders' Resource Links | |
| TDTrader.com has not added any product or service information to TRADERS' RESOURCE. | |
Click here for more information about our publications!
Comments
Date: 01/28/06Rank: 4Comment:

Request Information From Our Sponsors
- StockCharts.com, Inc.
- Candle Patterns
- Candlestick Charting Explained
- Intermarket Technical Analysis
- John Murphy on Chart Analysis
- John Murphy's Chart Pattern Recognition
- John Murphy's Market Message
- MurphyExplainsMarketAnalysis-Intermarket Analysis
- MurphyExplainsMarketAnalysis-Visual Analysis
- StockCharts.com
- Technical Analysis of the Financial Markets
- The Visual Investor
- VectorVest, Inc.
- Executive Premier Workshop
- One-Day Options Course
- OptionsPro
- Retirement Income Workshop
- Sure-Fire Trading Systems (VectorVest, Inc.)
- Trading as a Business Workshop
- VectorVest 7 EOD
- VectorVest 7 RealTime/IntraDay
- VectorVest AutoTester
- VectorVest Educational Services
- VectorVest OnLine
- VectorVest Options Analyzer
- VectorVest ProGraphics v6.0
- VectorVest ProTrader 7
- VectorVest RealTime Derby Tool
- VectorVest Simulator
- VectorVest Variator
- VectorVest Watchdog
