HOT TOPICS LIST
- MACD
- Fibonacci
- RSI
- Gann
- ADXR
- Stochastics
- Volume
- Triangles
- Futures
- Cycles
- Volatility
- ZIGZAG
- MESA
- Retracement
- Aroon
INDICATORS LIST
LIST OF TOPICS
PRINT THIS ARTICLE
by David Penn
Is the price of crude oil lifting sugar prices higher?
Position: N/A
David Penn
Technical Writer for Technical Analysis of STOCKS & COMMODITIES magazine, Working-Money.com, and Traders.com Advantage.
PRINT THIS ARTICLE
BREAKOUTS
A Sweet Breakout
01/25/06 08:05:51 AMby David Penn
Is the price of crude oil lifting sugar prices higher?
Position: N/A
Here's an interesting thought from the world of fundamental intermarket analysis: Why are sugar prices going through the roof? Consider this from The Street's market reporter, Nick Godt:The price of sugar was flirting with 25-year highs Tuesday, and it's not because of surging demand from sweet-toothed consumers. Instead, it's because Brazil signaled it would divert more of its sugar production to make ethanol, an alternative to gasoline to power cars. |

|
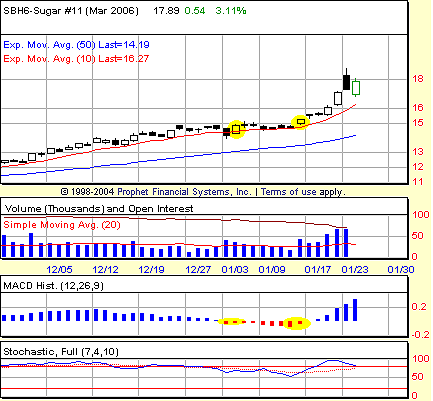
| FIGURE 1: MARCH SUGAR FUTURES, DAILY. The ovals highlight two bullish signal days based on positive reversals in the MACD histogram. |
| Graphic provided by: Prophet Financial, Inc. |
| |
| I heard something similar on NPR, so even if the story of sugar at the present time is not quite as much a story about crude oil as some would have us believe, the meme exists and it is spreading — as least as far as the sugar pits in New York are concerned, that is. |
| I always find it instructive to retrace the steps of a major breakout, such as what sugar has produced in January 2006, to see what technical clues were available to market technicians at the time. In this instance, hindsight is better than 20/20 because reviewing opportunities not taken only improves a trader's chance of seizing similar opportunities when they present themselves in the future, as they always do. |
| Here, simple positive reversals in the moving average convergence/divergence (MACD) histogram provided key signals for those looking for opportunities and target entries for riding sugar higher. By "positive reversal," I'm referring to those instances in which a MACD histogram (or any histogram, for that matter) that has been producing lower and lower (including negatively valued) histogram bars suddenly stops and creates a bar that is higher in value than the one immediately before it. It is a simple concept, one that was introduced to me from my reading of Alexander Elder's excellent trading primer, Trading For A Living. Elder was somewhat reluctant to use the MACD histogram in this way on the daily time frame (preferring its use on the weekly). But the work I've done with the MACD histogram over the past few years suggests that, with the proper parameters and risk management, this approach to spotting swing entries remains a sound one. |
| Let's look specifically at what this approach would have wrought in January as far as the March sugar futures contract (SBH6) was concerned (Figure 1). The first positive reversal in SBH6 in January came on the fourth of the month as a negative MACDH bar was followed by one that was slightly less negative. A second positive reversal in SBH6 occurred a few days later on January 13 as, once again, a negative MACDH bar was followed by one that was less negative. The January 4th positive reversal indicated a bid at 1518 (15.18 cents), which was hit on January 13, ironically enough. The January 13th positive reversal indicated a bid at 1550 (15.50 cents), which was hit on January 17. In both instances, with March sugar trading at 17.89 cents as of this writing, traders who took advantage of the lull in sugar prices in early January were richly rewarded come the end of the month. |
Technical Writer for Technical Analysis of STOCKS & COMMODITIES magazine, Working-Money.com, and Traders.com Advantage.
| Title: | Technical Writer |
| Company: | Technical Analysis, Inc. |
| Address: | 4757 California Avenue SW |
| Seattle, WA 98116 | |
| Phone # for sales: | 206 938 0570 |
| Fax: | 206 938 1307 |
| Website: | www.Traders.com |
| E-mail address: | DPenn@traders.com |
Traders' Resource Links | |
| Charting the Stock Market: The Wyckoff Method -- Books | |
| Working-Money.com -- Online Trading Services | |
| Traders.com Advantage -- Online Trading Services | |
| Technical Analysis of Stocks & Commodities -- Publications and Newsletters | |
| Working Money, at Working-Money.com -- Publications and Newsletters | |
| Traders.com Advantage -- Publications and Newsletters | |
| Professional Traders Starter Kit -- Software | |
Click here for more information about our publications!
Comments
Date: 01/28/06Rank: 2Comment:

Request Information From Our Sponsors
- StockCharts.com, Inc.
- Candle Patterns
- Candlestick Charting Explained
- Intermarket Technical Analysis
- John Murphy on Chart Analysis
- John Murphy's Chart Pattern Recognition
- John Murphy's Market Message
- MurphyExplainsMarketAnalysis-Intermarket Analysis
- MurphyExplainsMarketAnalysis-Visual Analysis
- StockCharts.com
- Technical Analysis of the Financial Markets
- The Visual Investor
- VectorVest, Inc.
- Executive Premier Workshop
- One-Day Options Course
- OptionsPro
- Retirement Income Workshop
- Sure-Fire Trading Systems (VectorVest, Inc.)
- Trading as a Business Workshop
- VectorVest 7 EOD
- VectorVest 7 RealTime/IntraDay
- VectorVest AutoTester
- VectorVest Educational Services
- VectorVest OnLine
- VectorVest Options Analyzer
- VectorVest ProGraphics v6.0
- VectorVest ProTrader 7
- VectorVest RealTime Derby Tool
- VectorVest Simulator
- VectorVest Variator
- VectorVest Watchdog
