HOT TOPICS LIST
- MACD
- Fibonacci
- RSI
- Gann
- ADXR
- Stochastics
- Volume
- Triangles
- Futures
- Cycles
- Volatility
- ZIGZAG
- MESA
- Retracement
- Aroon
INDICATORS LIST
LIST OF TOPICS
PRINT THIS ARTICLE
by David Penn
Does an October-December consolidation in the Amex Networking Index suggest more upside once a January pullback runs its course?
Position: N/A
David Penn
Technical Writer for Technical Analysis of STOCKS & COMMODITIES magazine, Working-Money.com, and Traders.com Advantage.
PRINT THIS ARTICLE
CUP WITH HANDLE
A Cup With Handle Consolidation In Networking Stocks
01/24/06 07:59:31 AMby David Penn
Does an October-December consolidation in the Amex Networking Index suggest more upside once a January pullback runs its course?
Position: N/A
| So often we see market moves in isolation, a trend upward or downward, detached from all but the market's most recent breakout or breakdown. There's no real flaw in this. Depending on the analytic or trading perspective, a trader or speculator may not need to know anything more than the past three months' worth of price action, for example, in order to make a sound trade based on a clear-headed appraisal of potential risks and rewards. |

|
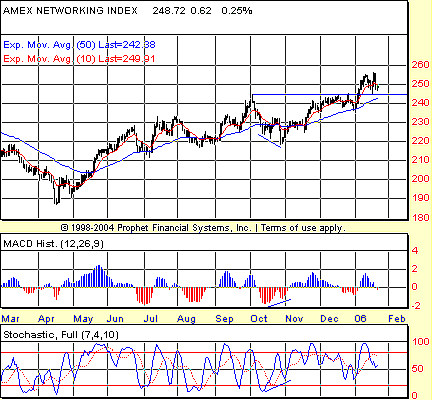
| FIGURE 1: AMEX NETWORKING INDEX, DAILY. The cup with handle consolidation over the autumn of 2005 leads to a breakout in early January. If support at the breakout level holds (roughly 245), then traders should be prepared for significant upside going forward. Note also the positive divergences in the stochastic and the MACD histogram at the low point of the cup with handle pattern. |
| Graphic provided by: Prophet Financial, Inc. |
| |
| But it is always worthwhile to take a step back from a market to see if a given market move (or lack thereof) is occurring in a context that might tell traders and speculators more about the prospects of that market to continue moving, stall, or even reverse. In the current case of the AMEX Networking Index ($NWX) (Figure 1), an index of stocks many of which were once high-flying heralds of a new telecosmic age (to steal a line from dotcom era telecom guru George Gilder), we find an example of how beneficial contextualizing a given market move can be. |
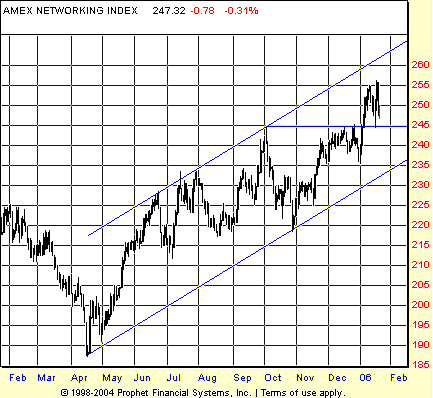
| The $NWX bottomed in the spring of 2005 and then embarked upon a bull market that saw it move from just under 190 in mid-April to over 240 by earliest October (Figure 2). The correction in October was not severe; by some accounts, $NWX moved more sideways than higher during the summer months. And the decline in October never took out a correction low from that advance. Nevertheless, the correction did set up a key bottom in October, one that came equipped with a positive divergence in both the stochastic and the moving average convergence/divergence histogram (MACDH). As I have said before, not every important low will be accompanied by such positive divergences. But when these divergences do develop, they are often vitally important signs of a market ready to reverse. |

|
| FIGURE 2: AMEX NETWORKING INDEX, DAILY. A trend channel connects the spring and autumn lows, and shows the $NWX moving swiftly toward a potential test of the channel's upper boundary. |
| Graphic provided by: Prophet Financial, Inc. |
| |
| In this case, the reversal found the $NWX bottoming just below 220 in late October. As the $NWX moved higher over the course of the autumn, including a largely sideways December with a short-term dip lower toward the end of the month, a cup with handle pattern emerged. Next to head & shoulders patterns, triangles, and double tops/bottoms, the cup with handle pattern might be the most widely recognized pattern by technicians and even nontechnicians. Investor's Business Daily founder William O'Neil, one of those who has helped popularize the cup with handle pattern, refers to it as "one of the most fundamental chart-base price patterns." |
| It appears as if $NWX has spent the balance of January pulling back toward the breakout level at roughly 245. Should this breakout level prove to be effective support, then networking stocks should move higher as the spring begins -- and could even provide leadership for the rest of the technology sector, if not the rest of the market. The upside minimum projection from this cup with handle pattern, a projection based on formation size, puts the 270 level in the sights of those bulls who profited from the autumn advance in networking stocks and are ready for another round on the upside. |
Technical Writer for Technical Analysis of STOCKS & COMMODITIES magazine, Working-Money.com, and Traders.com Advantage.
| Title: | Technical Writer |
| Company: | Technical Analysis, Inc. |
| Address: | 4757 California Avenue SW |
| Seattle, WA 98116 | |
| Phone # for sales: | 206 938 0570 |
| Fax: | 206 938 1307 |
| Website: | www.Traders.com |
| E-mail address: | DPenn@traders.com |
Traders' Resource Links | |
| Charting the Stock Market: The Wyckoff Method -- Books | |
| Working-Money.com -- Online Trading Services | |
| Traders.com Advantage -- Online Trading Services | |
| Technical Analysis of Stocks & Commodities -- Publications and Newsletters | |
| Working Money, at Working-Money.com -- Publications and Newsletters | |
| Traders.com Advantage -- Publications and Newsletters | |
| Professional Traders Starter Kit -- Software | |
Click here for more information about our publications!
Comments
Date: 01/28/06Rank: 3Comment:

Request Information From Our Sponsors
- StockCharts.com, Inc.
- Candle Patterns
- Candlestick Charting Explained
- Intermarket Technical Analysis
- John Murphy on Chart Analysis
- John Murphy's Chart Pattern Recognition
- John Murphy's Market Message
- MurphyExplainsMarketAnalysis-Intermarket Analysis
- MurphyExplainsMarketAnalysis-Visual Analysis
- StockCharts.com
- Technical Analysis of the Financial Markets
- The Visual Investor
- VectorVest, Inc.
- Executive Premier Workshop
- One-Day Options Course
- OptionsPro
- Retirement Income Workshop
- Sure-Fire Trading Systems (VectorVest, Inc.)
- Trading as a Business Workshop
- VectorVest 7 EOD
- VectorVest 7 RealTime/IntraDay
- VectorVest AutoTester
- VectorVest Educational Services
- VectorVest OnLine
- VectorVest Options Analyzer
- VectorVest ProGraphics v6.0
- VectorVest ProTrader 7
- VectorVest RealTime Derby Tool
- VectorVest Simulator
- VectorVest Variator
- VectorVest Watchdog
