HOT TOPICS LIST
- MACD
- Fibonacci
- RSI
- Gann
- ADXR
- Stochastics
- Volume
- Triangles
- Futures
- Cycles
- Volatility
- ZIGZAG
- MESA
- Retracement
- Aroon
INDICATORS LIST
LIST OF TOPICS
PRINT THIS ARTICLE
by Gary Grosschadl
The Philadelphia Bank Index looks susceptible to a correction, and this could evolve into a triple-top formation.
Position: Sell
Gary Grosschadl
Independent Canadian equities trader and technical analyst based in Peterborough
Ontario, Canada.
PRINT THIS ARTICLE
TRITOP/TRI BOTTOM
Bank Index Topped Out?
01/23/06 08:24:32 AMby Gary Grosschadl
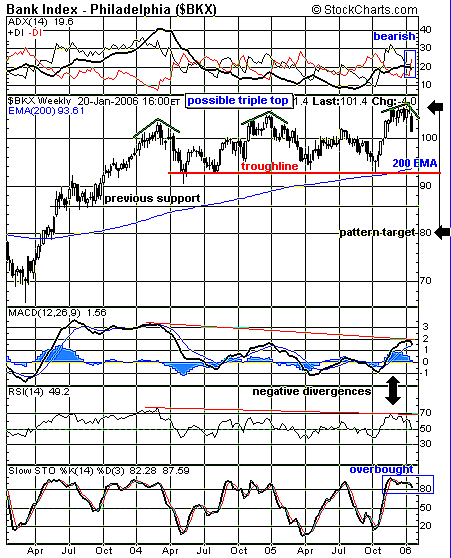
The Philadelphia Bank Index looks susceptible to a correction, and this could evolve into a triple-top formation.
Position: Sell
| Although the tops are rising rather than equal, the formation is close enough to warrant consideraton. The 24 geographically diverse banking institutions that make up the index are an important market sector that reflect the health of the overall markets. Topping action here would argue potential drops in the overall indexes. |
| The large bearish candlestick, gapping down, hints at a downleg starting with some conviction on this weekly chart (Figure 1). At this early stage, the triple top is only a consideration, as it needs to drop below its troughline to qualify as an actual triple top. Should this formation evolve into a full-pattern breakdown, then the pattern target would be a drop to 80. This equals the distance from the peak to the troughline, applied below the troughline. |

|
| FIGURE 1: PHILADELPHIA BANK INDEX. The weekly chart hints at a topping formation. |
| Graphic provided by: StockCharts.com. |
| |
| Along the way, two other possible support levels can come into play. The 200-period EMA (exponential moving average) is often an area of potential strong support, especially since it is very close to the troughline, which can also act as support. Further below but still above the pattern target is an area of previous support at the 86 level. Charts can often show an uncanny respect for previous support levels. |
| Several indicators also hint at potential bearish developments. At the top of the chart, the directional movement indicators are just crossing over. With -DI above +DI, bearish power starts to assume control. A rising average directional index (ADX) above 20 would confirm a strong trend. Below the chart, we can see negative divergences between price action and the MACD (moving average convergence/divergence) and the RSI (relative strength index). Divergences like this often point to coming corrections in price action. The stochastics indicator shows its own toppiness in overbought territory and turning down. |
| Whether this downturn turns into a more serious correction remains to be seen. The first real test occurs at the troughline and the 200-period EMA zone. A close below that level indicates a triple top playing out. |
Independent Canadian equities trader and technical analyst based in Peterborough
Ontario, Canada.
| Website: | www.whatsonsale.ca/financial.html |
| E-mail address: | gwg7@sympatico.ca |
Click here for more information about our publications!
Comments
Date: 01/23/06Rank: 5Comment:

|

Request Information From Our Sponsors
- StockCharts.com, Inc.
- Candle Patterns
- Candlestick Charting Explained
- Intermarket Technical Analysis
- John Murphy on Chart Analysis
- John Murphy's Chart Pattern Recognition
- John Murphy's Market Message
- MurphyExplainsMarketAnalysis-Intermarket Analysis
- MurphyExplainsMarketAnalysis-Visual Analysis
- StockCharts.com
- Technical Analysis of the Financial Markets
- The Visual Investor
- VectorVest, Inc.
- Executive Premier Workshop
- One-Day Options Course
- OptionsPro
- Retirement Income Workshop
- Sure-Fire Trading Systems (VectorVest, Inc.)
- Trading as a Business Workshop
- VectorVest 7 EOD
- VectorVest 7 RealTime/IntraDay
- VectorVest AutoTester
- VectorVest Educational Services
- VectorVest OnLine
- VectorVest Options Analyzer
- VectorVest ProGraphics v6.0
- VectorVest ProTrader 7
- VectorVest RealTime Derby Tool
- VectorVest Simulator
- VectorVest Variator
- VectorVest Watchdog
