HOT TOPICS LIST
- MACD
- Fibonacci
- RSI
- Gann
- ADXR
- Stochastics
- Volume
- Triangles
- Futures
- Cycles
- Volatility
- ZIGZAG
- MESA
- Retracement
- Aroon
INDICATORS LIST
LIST OF TOPICS
PRINT THIS ARTICLE
by Paolo Pezzutti
Prices tested resistance levels and started a correction.
Position: N/A
Paolo Pezzutti
Author of the book "Trading the US Markets - A Comprehensive Guide to US Markets for International Traders and Investors" - Harriman House (July 2008)
PRINT THIS ARTICLE
TECHNICAL ANALYSIS
Emini NASDAQ: Weakness Ahead
01/23/06 04:00:51 PMby Paolo Pezzutti
Prices tested resistance levels and started a correction.
Position: N/A
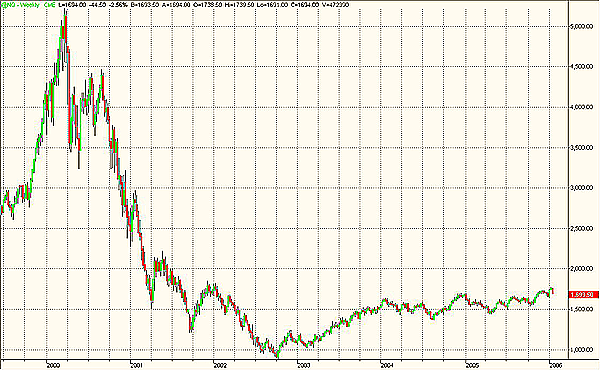
| After the March 2000 high at about 5000, the NASDAQ moved down very quickly, starting a two-year downtrend and printing a new relative low only in October 2002 at about 885. During the three years since, prices managed to double, reaching the 1774 level two weeks ago (Figure 1). The emini NASDAQ printed an uptrend that gave back partially the heavy losses suffered between 2000 and 2002 -- not enough for many investors badly hit after 2000. |

|
| FIGURE 1: EMINI NASDAQ WEEKLY. A low volatility uptrend managed to recover partially the heavy losses suffered between 2000 and 2002. |
| Graphic provided by: TradeStation. |
| |
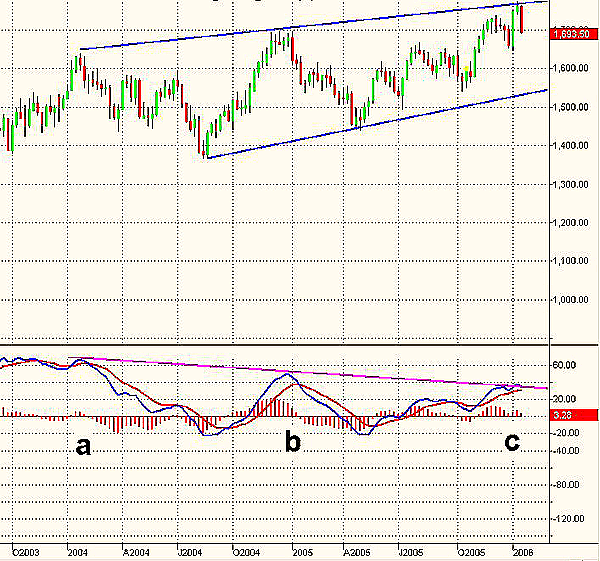
| Let's analyze the technical conditions using the moving average convergence/divergence (MACD) indicator applied to the weekly chart in Figure 2. It calculates two exponential moving averages (EMAs). The difference between these two averages is plotted as the MACD (blue line). This value is averaged and then plotted as the MACDAvg (red line). The difference between MACD and MACD average is plotted as the MACDDiff (red histogram). Since 2004, prices have been moving within a slightly converging channel. The MACD printed negative divergences with the January 2004, December 2004, and January 2006 tops (points A, B, and C). At present, prices have tested the higher trendline without success. |

|
| FIGURE 2: EMINI NASDAQ WEEKLY. Multiple negative MACD divergences are printed in this time frame. |
| Graphic provided by: TradeStation. |
| |
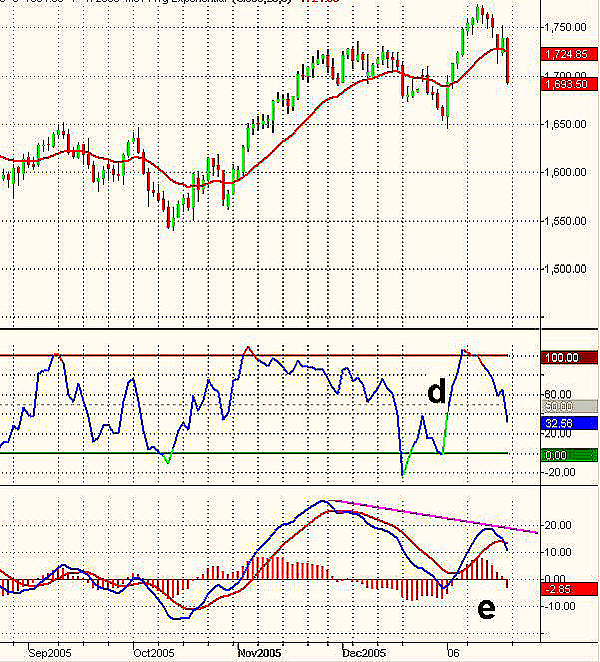
| At the daily level, in Figure 3, the MACD is decreasing and it has crossed its moving average. MACDiff is negative, indicating an ongoing consolidation at these levels. Note the negative divergence printed by the indicator with the new high (point E) of January 11. The test of this resistance is not easy. The emini NASDAQ arrived at these levels after a nine-month upleg and an advance of prices of more than 20%. The Bollinger %b (close), which can be used to tell us where we are within the Bollinger Bands (%b=(last close-Upper Band)/(Upper Band-Lower Band), printed a positive divergence at point D, exiting from the oversold area and indicating the beginning of the last upleg at the beginning of the new year. This leg has been very short when compared to previous impulses. It is an important indication that, at these levels, investors are not willing to commit to further price increase. The indicator left the overbought area, providing a sell signal, another indication of weakness in this time frame. The January 20th trading session printed a wide-ranging day. This pattern occurs when volatility exceeds the average volatility of the past n days. The trading day volatility ratio (VR), which is the true range divided by the true range of the past n-day period, must be greater than k (for example, k=2). A wide-ranging day occurs when the public enters the market, bringing fresh money. It is a strong indication of the future market direction. The high-volatility increase to the downside indicates that the market sentiment has shifted quickly, with the public's emotions involved in the trading session. We should see lower prices in this time frame to test the important support at 1650. The high of the wide-ranging day at 1740 and the top at 1774 are now significant resistance levels. |

|
| FIGURE 3: EMINI NASDAQ DAILY. Prices have quickly corrected more than 50% of the upleg. Indicators are displaying weakness. |
| Graphic provided by: TradeStation. |
| |
| Divergences alone cannot state the end of a trend. You can have many false signals before you have a correct indication. Divergences are, however, a useful tool for traders to assess the risk. At the weekly level, this could mean that risk is getting higher at these levels. A directional impulse brings volatility in the direction of the trend. In the daily time frame, an impulse to the downside has been printed; after that, at the higher time frame, prices have approached resistance levels. In addition, the market appears to be more "news-driven" and overreacting to news than in the past months. It is early to say that the uptrend is over, but I believe that at least a consolidation period is ahead. It is important to observe how this correction/consolidation phase develops. Should prices develop a trading range in the next week's close to the resistance level, this would increase the market chance to reach new highs. Should the emini NASDAQ start a deeper correction, it will be difficult to see a new leg of the uptrend to develop soon. |
Author of the book "Trading the US Markets - A Comprehensive Guide to US Markets for International Traders and Investors" - Harriman House (July 2008)
| Address: | VIA ROBERTO AGO 26 POSTAL CODE 00166 |
| Rome, ITALY | |
| Phone # for sales: | +393357540708 |
| E-mail address: | pezzutti.paolo@tiscali.it |
Click here for more information about our publications!
Comments
Date: 01/23/06Rank: 3Comment:

Request Information From Our Sponsors
- StockCharts.com, Inc.
- Candle Patterns
- Candlestick Charting Explained
- Intermarket Technical Analysis
- John Murphy on Chart Analysis
- John Murphy's Chart Pattern Recognition
- John Murphy's Market Message
- MurphyExplainsMarketAnalysis-Intermarket Analysis
- MurphyExplainsMarketAnalysis-Visual Analysis
- StockCharts.com
- Technical Analysis of the Financial Markets
- The Visual Investor
- VectorVest, Inc.
- Executive Premier Workshop
- One-Day Options Course
- OptionsPro
- Retirement Income Workshop
- Sure-Fire Trading Systems (VectorVest, Inc.)
- Trading as a Business Workshop
- VectorVest 7 EOD
- VectorVest 7 RealTime/IntraDay
- VectorVest AutoTester
- VectorVest Educational Services
- VectorVest OnLine
- VectorVest Options Analyzer
- VectorVest ProGraphics v6.0
- VectorVest ProTrader 7
- VectorVest RealTime Derby Tool
- VectorVest Simulator
- VectorVest Variator
- VectorVest Watchdog
