HOT TOPICS LIST
- MACD
- Fibonacci
- RSI
- Gann
- ADXR
- Stochastics
- Volume
- Triangles
- Futures
- Cycles
- Volatility
- ZIGZAG
- MESA
- Retracement
- Aroon
INDICATORS LIST
LIST OF TOPICS
PRINT THIS ARTICLE
by David Penn
Consolidations in trends are often resolved by further movement in the direction of the previous trend. This is not one of those consolidations.
Position: N/A
David Penn
Technical Writer for Technical Analysis of STOCKS & COMMODITIES magazine, Working-Money.com, and Traders.com Advantage.
PRINT THIS ARTICLE
CONSOLID FORMATION
From Consolidation To Top
01/20/06 12:03:27 PMby David Penn
Consolidations in trends are often resolved by further movement in the direction of the previous trend. This is not one of those consolidations.
Position: N/A
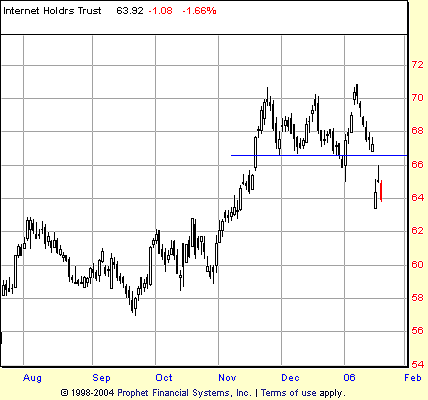
| Professional wrestler Triple H — also known as the "cerebral assassin" — calls his finishing move "the pedigree." What is "pedigree," you ask? Well, apparently, you stand face to face with your opponent and put his head between your legs. You then pull his arms back behind his back in what I guess is a sort of chicken wing hold or something. Your opponent thus restrained, you then pull his body into the air (by the arms?) and drop to your knees. Hmmm, sounds painful ... and a lot like what has happened in recent days to the other triple H — the Internet HOLDRS, also known as HHH (Figure 1). |

|
| FIGURE 1: INTERNET HOLDRS, DAILY. A consolidation from mid-November 2005 to early January 2006 turns into a top by mid-January, retracing fully 50% of the HHH's advance since the lows of September. |
| Graphic provided by: Prophet Financial, Inc. |
| |
| Consolidations in trends generally lead to continuations of the previous trend as soon as whatever accumulation or distribution has run its course. The flipside of this technical analysis truism is that consolidations in trends that don't function as continuations tend to function as tops or bottoms — that is to say, reversals. And whether or not those reversals end up as mere corrections, or dips to be bought, or full-fledged reversals in trend, those who have benefited from the previous trend are well-advised to be wary. |
| The bull market in HHH actually ends further back in time than the September lows shown in Figure 1. It could be argued that the origins of this bull market extend back to the spring of 2005. In any event, however, the market had recovered from a correction in that bull trend, a two-month correction from August through September 2005, and was moving strongly higher by November. Along with the rest of the market, HHH made little progress in December, and found itself bounding higher in January. |

|
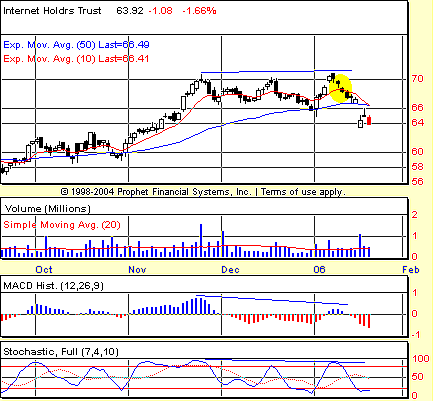
| FIGURE 2: INTERNET HOLDRS, DAILY. Negative divergences in the stochastic and the MACD histogram suggested that the consolidation in HHH might not resolve itself with an immediate resumption of the previous bull trend. |
| Graphic provided by: Prophet Financial, Inc. |
| |
| As I mentioned before, consolidations such as the one that developed from mid-November to early January often serve as zones of accumulation. In this capacity, such consolidations give the market time for new buyers to climb on board, and for sellers to take their profits and move on. However, consolidations can also represent zones of distribution during which savvy sellers not only take profits from their positions, but "distribute" stock that they don't own as well. In these instances, in which sellers are joined by short-sellers, consolidations are far more likely to serve as tops, ultimately forcing a market to give up a significant amount of its previous gains. How can speculators determine whether a consolidation in a trend is merely a consolidation or a top? Figure 2 shows a few factors that technicians can consider when evaluating consolidations in trends. These factors include negative stochastic divergences, especially when confirmed by negative divergences in another indicator such as the moving average convergence/divergence (MACD) histogram. In addition, in the case of the HHH shown in Figure 2, note that there is a 2B/Turtle Soup top between the highs of late November and the highs of early January. The market makes a higher high in January vis-a-vis November, yet there is no follow-through to the upside. In fact, the higher high in January is itself a bearish engulfing pattern, a candlestick pattern that signals a reversal when it occurs at the top of a trend! |
| The offer of HHH appeared on January 10, just as the MACD histogram and the stochastic turned downward. The short entry price — based on the pair of negative divergences — was 68.48, which would have been filled on the following day. Five days later, HHH closed at 65. As of this writing, the triple H (the stock version) was closer to 63. This same method would have produced a minor gain in early December (buying the bounce near the 10-day exponential moving average [EMA]) and a likely breakeven long trade in early January (buying the bounce off the 50-day EMA). |
Technical Writer for Technical Analysis of STOCKS & COMMODITIES magazine, Working-Money.com, and Traders.com Advantage.
| Title: | Technical Writer |
| Company: | Technical Analysis, Inc. |
| Address: | 4757 California Avenue SW |
| Seattle, WA 98116 | |
| Phone # for sales: | 206 938 0570 |
| Fax: | 206 938 1307 |
| Website: | www.Traders.com |
| E-mail address: | DPenn@traders.com |
Traders' Resource Links | |
| Charting the Stock Market: The Wyckoff Method -- Books | |
| Working-Money.com -- Online Trading Services | |
| Traders.com Advantage -- Online Trading Services | |
| Technical Analysis of Stocks & Commodities -- Publications and Newsletters | |
| Working Money, at Working-Money.com -- Publications and Newsletters | |
| Traders.com Advantage -- Publications and Newsletters | |
| Professional Traders Starter Kit -- Software | |
Click here for more information about our publications!
Comments
Date: 01/23/06Rank: 3Comment:
Date: 01/24/06Rank: 4Comment:

Request Information From Our Sponsors
- VectorVest, Inc.
- Executive Premier Workshop
- One-Day Options Course
- OptionsPro
- Retirement Income Workshop
- Sure-Fire Trading Systems (VectorVest, Inc.)
- Trading as a Business Workshop
- VectorVest 7 EOD
- VectorVest 7 RealTime/IntraDay
- VectorVest AutoTester
- VectorVest Educational Services
- VectorVest OnLine
- VectorVest Options Analyzer
- VectorVest ProGraphics v6.0
- VectorVest ProTrader 7
- VectorVest RealTime Derby Tool
- VectorVest Simulator
- VectorVest Variator
- VectorVest Watchdog
- StockCharts.com, Inc.
- Candle Patterns
- Candlestick Charting Explained
- Intermarket Technical Analysis
- John Murphy on Chart Analysis
- John Murphy's Chart Pattern Recognition
- John Murphy's Market Message
- MurphyExplainsMarketAnalysis-Intermarket Analysis
- MurphyExplainsMarketAnalysis-Visual Analysis
- StockCharts.com
- Technical Analysis of the Financial Markets
- The Visual Investor
