HOT TOPICS LIST
- MACD
- Fibonacci
- RSI
- Gann
- ADXR
- Stochastics
- Volume
- Triangles
- Futures
- Cycles
- Volatility
- ZIGZAG
- MESA
- Retracement
- Aroon
INDICATORS LIST
LIST OF TOPICS
PRINT THIS ARTICLE
by Dennis D. Peterson
The accumulation/distribution indicator can be very useful to confirm the accumulation and distribution phases of a stock's buying and selling, better than on-balance volume (OBV) in many instances.
Position: N/A
Dennis D. Peterson
Market index trading on a daily basis.
PRINT THIS ARTICLE
ACCUM./DIST. CHAIKIN
Accumulation/Distribution
08/16/00 03:38:59 PMby Dennis D. Peterson
The accumulation/distribution indicator can be very useful to confirm the accumulation and distribution phases of a stock's buying and selling, better than on-balance volume (OBV) in many instances.
Position: N/A
| Accumulation/distribution (A/D) is a momentum indicator that indicates how much up volume versus down volume a stock has accumulated. Unlike OBV, on-balance volume (see "Bowl Confirmation", 7/17), which puts all of the day's volume in running totals of up volume and down volume, depending on whether today's close was higher than yesterday's, A/D puts in a proportion based on where today's close finished relative to today's open and low. |
| The formula used by A/D for accumulating volume is based on the proportion of price change for the day. The denominator is the high minus the low. The numerator consists of the difference between (high-close) and (close-low), so A/D is: The summation of (( (close-low) - (high-close) ) / ( high-low ) ) x volume. |

|
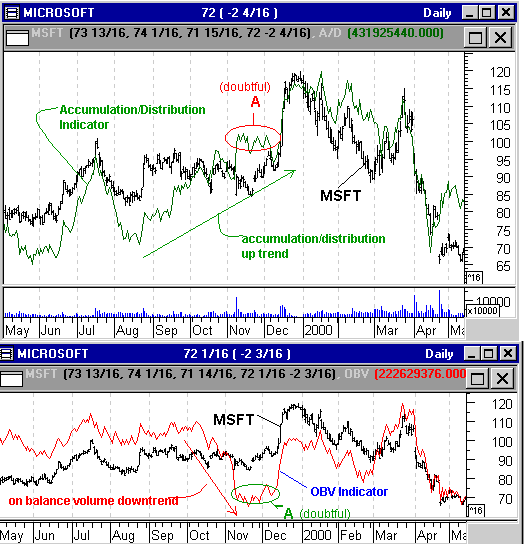
| Figure 1: Accumulation/distribution shows an uptrend from late August through October. For the same period on-balance volume shows no change and then shows a trend down. |
| Graphic provided by: MetaStock. |
| |
| If the close is exactly between the high and low, then close-low equals high-close and zero is added. If the close is very near the high then high-close is small and close-low is large, with the result being a numerator that is positive and proportionately larger. If the close is near the low, the numerator becomes negative. In comparison, OBV would put all of the volume into its running summation, adding when today's close was higher than yesterday's and subtracting when it was lower. When a stock breaks out then both indicators will put all the volume in their running totals. As a top is reached with the rate of the price change decreasing, then A/D will see it. OBV will not. The same will happen with a bottom. If selling is at a climax, both indicators will show it. |
| Figure 1 illustrates further differences between the two indicators. The top chart shows Microsoft's price action with an A/D overlay. On the bottom chart is Microsoft with an OBV overlay. A/D shows an uptrend starting in August 1999, while OBV is moving sideways or what is termed "doubtful." Doubtful because you can't tell if accumulation or distribution is occurring. OBV then develops a downtrend starting in October. A/D shows a continued uptrend in October. In November and December, shown as area A in the two charts, both indicators are doubtful. They haven't reversed but they are saying "I don't know". The major difference is that A/D has correctly identified the upside breakout condition to soon follow, by virtue of the uptrend and not reversing. Using OBV, the analyst would have to assume that the accumulation of MSFT would lead to an upside breakout. OBV did give some indication of an uptrend starting in December '99. The problem is that the amount of "uptrend" is less movement than seen in the July through September range of OBV. |
| [Writer's note: in describing the Chaikin Oscillator (posted 7/27/00) exponential moving averages were used. A reader has pointed out that simple moving averages are used. Since I have published references that say exponential in one case and simple in another, readers have a choice. Exponential will weight the most recent data, while simple will give all data the same weight.] |
Market index trading on a daily basis.
| Title: | Staff Writer |
| Company: | Technical Analysis, Inc. |
| Address: | 4757 California Ave SW |
| Seattle, WA 98116-4499 | |
| Phone # for sales: | 206 938 0570 |
| Fax: | 206 938 1307 |
| Website: | www.traders.com |
| E-mail address: | dpeterson@traders.com |
Traders' Resource Links | |
| Charting the Stock Market: The Wyckoff Method -- Books | |
| Working-Money.com -- Online Trading Services | |
| Traders.com Advantage -- Online Trading Services | |
| Technical Analysis of Stocks & Commodities -- Publications and Newsletters | |
| Working Money, at Working-Money.com -- Publications and Newsletters | |
| Traders.com Advantage -- Publications and Newsletters | |
| Professional Traders Starter Kit -- Software | |
Click here for more information about our publications!
Comments

Request Information From Our Sponsors
- StockCharts.com, Inc.
- Candle Patterns
- Candlestick Charting Explained
- Intermarket Technical Analysis
- John Murphy on Chart Analysis
- John Murphy's Chart Pattern Recognition
- John Murphy's Market Message
- MurphyExplainsMarketAnalysis-Intermarket Analysis
- MurphyExplainsMarketAnalysis-Visual Analysis
- StockCharts.com
- Technical Analysis of the Financial Markets
- The Visual Investor
- VectorVest, Inc.
- Executive Premier Workshop
- One-Day Options Course
- OptionsPro
- Retirement Income Workshop
- Sure-Fire Trading Systems (VectorVest, Inc.)
- Trading as a Business Workshop
- VectorVest 7 EOD
- VectorVest 7 RealTime/IntraDay
- VectorVest AutoTester
- VectorVest Educational Services
- VectorVest OnLine
- VectorVest Options Analyzer
- VectorVest ProGraphics v6.0
- VectorVest ProTrader 7
- VectorVest RealTime Derby Tool
- VectorVest Simulator
- VectorVest Variator
- VectorVest Watchdog
