HOT TOPICS LIST
- MACD
- Fibonacci
- RSI
- Gann
- ADXR
- Stochastics
- Volume
- Triangles
- Futures
- Cycles
- Volatility
- ZIGZAG
- MESA
- Retracement
- Aroon
INDICATORS LIST
LIST OF TOPICS
PRINT THIS ARTICLE
by Alexander Nikolov
Apply the Elliott wave theory in the currency market and see what happens.
Position: N/A
Alexander Nikolov
Alexander Nikolov is the chief technical analyst and head of International Capital Markets Department at Karoll - Finance House (www.karoll.net) - a leading Bulgarian brokerage firm. His experience includes coverage of the US stock market, East European markets, and major currencies.
PRINT THIS ARTICLE
ELLIOTT WAVE
Will The Medium-Term Downtrend In EUR/USD Resume Soon?
01/20/06 08:06:29 AMby Alexander Nikolov
Apply the Elliott wave theory in the currency market and see what happens.
Position: N/A
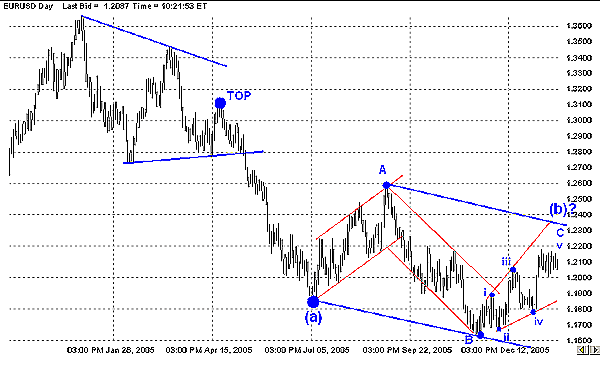
| The Elliott wave theory can be a powerful tool in analyzing the financial markets, but at the same time, most technicians seem to be convinced that it is open to interpretation. In order to reduce its subjectivity, we can use parallel channels to make a clear distinction between impulsive and corrective moves. A good example of that approach can be found in the interpretation of the EUR/USD daily chart (Figure 1). |

|
| FIGURE 1: EUR/USD, DAILY. The entire price action from the July 2005 low has been developing into a flat pattern that is a correction of the previous impulsive fall from 1.3123 (the April 2005 top) to 1.1866 (the July 2005 bottom). |
| Graphic provided by: www.forexnews.com. |
| |
| First, it is important to note that although the highest level achieved by the EUR/USD pair was in December 2004 at 1.3665, from the Elliott wave perspective, it is highly likely that the entire upmove from the beginning of 2002 has ended with a triangle. Thus, the top from the Elliott wave point of view should be marked at 1.3123 (April 2005 high). From there, we have a persistent decline to the July 2005 low of 1.1866. My attempts to be objective in labeling the subsequent price action, as shown, are based on the following observations: 1) The move from 1.1866 (July 2005 low) to 1.2587 (early September 2005 top) is contained in a perfect channel with lots of overlapping waves — these are clear indications of a corrective move 2) The move down from the 1.2587 top registers a new low at 1.1640, but it is again a clear three-wave move, and it is almost perfectly channeled — no doubt that this decline is corrective, despite the fact that it makes a new low. |
| So what's next? The fact that we have a corrective rally from 1.1866 to 1.2587, followed by a corrective decline to 1.1640, indicates that the entire pattern from the July 2005 low is unfinished and it is developing into either a flat pattern or a triangle, with the first possibility more likely. If we assume the flat-pattern hypothesis, then we should see a five-wave move from the 1.1640 low. And indeed, as depicted on Figure 1, the move from the 1.1640 low appears to be in five-waves, but all waves within this move are corrective and overlapping — indications that we are dealing with an ending diagonal pattern with a fifth-wave extension. Based on this assumption, a further advance toward the 1.2300/1.2400 area seems likely before the ending diagonal pattern is complete. Note that if such a rally occurs from the current levels, the entire corrective pattern from the July 2005 low will also be contained in a well-defined parallel channel. This in turn will further strengthen the validity of the presented wave count. |
| Once the current rally tops out in the suggested 1.23-1.24 zone, expect wave (c) down with a most probable target at 1.1170 (equality projection of the 1.3123-1.1866 fall measured from 1.2350; adjust this level with the exact high that is achieved). A break below 1.20 would signal that wave C of (b) is over; yet a move below 1.1777 is needed to confirm the MT downtrend from the April 2005 top has resumed. Only a move beyond 1.2587 (September 2005 top) would alter the presented medium-term bearish view, and would be an argument that a more solid bottom has been made earlier. |
Alexander Nikolov is the chief technical analyst and head of International Capital Markets Department at Karoll - Finance House (www.karoll.net) - a leading Bulgarian brokerage firm. His experience includes coverage of the US stock market, East European markets, and major currencies.
| Title: | Head of Department |
| Company: | Karoll |
| Phone # for sales: | 0035929811381 |
| Website: | www.karoll.net |
| E-mail address: | anikolov@karoll.net |
Traders' Resource Links | |
| Karoll has not added any product or service information to TRADERS' RESOURCE. | |
Click here for more information about our publications!
Comments
Date: 01/23/06Rank: 5Comment:
Date: 01/23/06Rank: 2Comment:

Request Information From Our Sponsors
- VectorVest, Inc.
- Executive Premier Workshop
- One-Day Options Course
- OptionsPro
- Retirement Income Workshop
- Sure-Fire Trading Systems (VectorVest, Inc.)
- Trading as a Business Workshop
- VectorVest 7 EOD
- VectorVest 7 RealTime/IntraDay
- VectorVest AutoTester
- VectorVest Educational Services
- VectorVest OnLine
- VectorVest Options Analyzer
- VectorVest ProGraphics v6.0
- VectorVest ProTrader 7
- VectorVest RealTime Derby Tool
- VectorVest Simulator
- VectorVest Variator
- VectorVest Watchdog
- StockCharts.com, Inc.
- Candle Patterns
- Candlestick Charting Explained
- Intermarket Technical Analysis
- John Murphy on Chart Analysis
- John Murphy's Chart Pattern Recognition
- John Murphy's Market Message
- MurphyExplainsMarketAnalysis-Intermarket Analysis
- MurphyExplainsMarketAnalysis-Visual Analysis
- StockCharts.com
- Technical Analysis of the Financial Markets
- The Visual Investor
