HOT TOPICS LIST
- MACD
- Fibonacci
- RSI
- Gann
- ADXR
- Stochastics
- Volume
- Triangles
- Futures
- Cycles
- Volatility
- ZIGZAG
- MESA
- Retracement
- Aroon
INDICATORS LIST
LIST OF TOPICS
PRINT THIS ARTICLE
by David Penn
Blood on the streets in Tokyo leads to a short-term buying opportunity in New York.
Position: N/A
David Penn
Technical Writer for Technical Analysis of STOCKS & COMMODITIES magazine, Working-Money.com, and Traders.com Advantage.
PRINT THIS ARTICLE
CUP WITH HANDLE
The Emini S&P's Cup With Handle Bottom
01/18/06 09:53:03 AMby David Penn
Blood on the streets in Tokyo leads to a short-term buying opportunity in New York.
Position: N/A
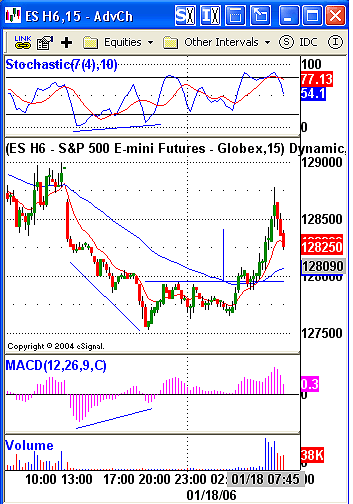
| If you're like me, then sometime late last night (Tuesday, January 17) you read a news story headlined something like this: "Selling Stampede Shuts Tokyo Exchange" If you're like me, then you shortly if not immediately afterward opened up a real-time intraday chart of the emini Standard & Poor's 500 futures contract and saw something like what is shown on the left side of Figure 1. |

|
| FIGURE 1: MARCH EMINI S&P 500, 15-MINUTE. Positive divergences in the stochastic and MACD histogram during an overnight decline led to a cup with handle bottom and a runup early in the next session. |
| Graphic provided by: eSignal. |
| |
| There are a number of interesting technical features here. During the overnight decline — induced by everything from disappointing earnings and outlooks from Yahoo and Intel to the forementioned "selling stampede" on the Tokyo Stock Exchange (allegedly prompted by a criminal investigation into an Internet start-up company) — both the stochastic and the moving average convergence/divergence (MACD) histogram showed a waning momentum on the part of the sellers. The higher lows in the troughs of both indicators during the decline created strong positive divergences that suggested that the selling would be over sooner than later. |
| The positive divergences didn't lead to an immediate rally in the March emini S&P (ESH6). Instead, the market moved sideways for several hours, developing a base in the form of a cup with handle pattern. Cup with handle patterns are classic bullish consolidations and, in the context of the positive divergences in the stochastic and MACD histogram, further supported the argument that this market had upside potential. |

|
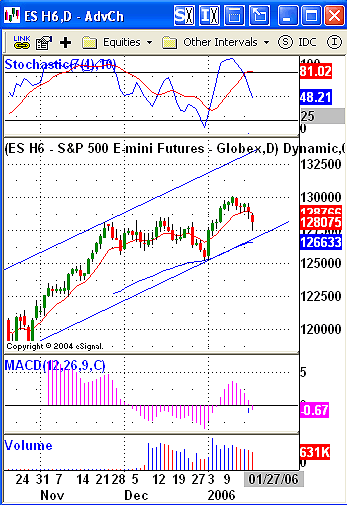
| FIGURE 2: MARCH EMINI S&P 500, DAILY. The selloff in the March emini moves the market closer to potential support at the lower boundary of a trend channel that extends back to late October 2005. |
| Graphic provided by: eSignal. |
| |
| By ending (or, at least, interrupting) its decline with a consolidation, the ESH6 provides an opportunity to gauge the magnitude of any bounce. In the case of the cup with handle bottom, the minimum extent of that bounce (read: breakout) can be determined by taking the size of the pattern and adding that amount to the value at the level of the breakout. Here, that would involve adding roughly five emini S&P points to a breakout level of approximately 1280 to get a minimum upside of 1285. That level was reached, and exceeded, a little over an hour after the breakout. Based on the 15-minute chart, the closing high was 1286.25. |
| Traders would have been well-advised not to overstay their welcome, however, and not to look the gift horse of an intraday pickup of five-odd emini S&P points (approximately $250 per contract) in the eye. The market reversed shortly after surpassing the minimum upside from the cup with handle breakout and, although Figure 1 does not show it, eventually fell back below the breakout level by noon New York time. Figure 2 shows if not why the breakout shown in the 15-minute chart did not hold, then at least why the market remains vulnerable to further short-term declines. The lower boundary of a trend channel that, on the daily chart, extends back to October 2005 is likely to provide some measure of support — and the fact that prices are approaching this level suggests that the market is coming under the "gravitational pull" of that support level. Combined with the month-long consolidation during December — which should also provide some measure of support — the decline still appears more likely to provide a buying opportunity for bulls than a redemption song for long-suffering bears. |
Technical Writer for Technical Analysis of STOCKS & COMMODITIES magazine, Working-Money.com, and Traders.com Advantage.
| Title: | Technical Writer |
| Company: | Technical Analysis, Inc. |
| Address: | 4757 California Avenue SW |
| Seattle, WA 98116 | |
| Phone # for sales: | 206 938 0570 |
| Fax: | 206 938 1307 |
| Website: | www.Traders.com |
| E-mail address: | DPenn@traders.com |
Traders' Resource Links | |
| Charting the Stock Market: The Wyckoff Method -- Books | |
| Working-Money.com -- Online Trading Services | |
| Traders.com Advantage -- Online Trading Services | |
| Technical Analysis of Stocks & Commodities -- Publications and Newsletters | |
| Working Money, at Working-Money.com -- Publications and Newsletters | |
| Traders.com Advantage -- Publications and Newsletters | |
| Professional Traders Starter Kit -- Software | |
Click here for more information about our publications!
Comments
Date: 01/18/06Rank: 3Comment:

Request Information From Our Sponsors
- StockCharts.com, Inc.
- Candle Patterns
- Candlestick Charting Explained
- Intermarket Technical Analysis
- John Murphy on Chart Analysis
- John Murphy's Chart Pattern Recognition
- John Murphy's Market Message
- MurphyExplainsMarketAnalysis-Intermarket Analysis
- MurphyExplainsMarketAnalysis-Visual Analysis
- StockCharts.com
- Technical Analysis of the Financial Markets
- The Visual Investor
- VectorVest, Inc.
- Executive Premier Workshop
- One-Day Options Course
- OptionsPro
- Retirement Income Workshop
- Sure-Fire Trading Systems (VectorVest, Inc.)
- Trading as a Business Workshop
- VectorVest 7 EOD
- VectorVest 7 RealTime/IntraDay
- VectorVest AutoTester
- VectorVest Educational Services
- VectorVest OnLine
- VectorVest Options Analyzer
- VectorVest ProGraphics v6.0
- VectorVest ProTrader 7
- VectorVest RealTime Derby Tool
- VectorVest Simulator
- VectorVest Variator
- VectorVest Watchdog
