HOT TOPICS LIST
- MACD
- Fibonacci
- RSI
- Gann
- ADXR
- Stochastics
- Volume
- Triangles
- Futures
- Cycles
- Volatility
- ZIGZAG
- MESA
- Retracement
- Aroon
INDICATORS LIST
LIST OF TOPICS
PRINT THIS ARTICLE
by David Penn
Reversals in the MACD histogram in gold, gold stock indexes, and mining shares suggest yellow metal leadership in the market's next leg up.
Position: N/A
David Penn
Technical Writer for Technical Analysis of STOCKS & COMMODITIES magazine, Working-Money.com, and Traders.com Advantage.
PRINT THIS ARTICLE
GOLD & METALS
Bids In Gold?
01/16/06 12:10:29 PMby David Penn
Reversals in the MACD histogram in gold, gold stock indexes, and mining shares suggest yellow metal leadership in the market's next leg up.
Position: N/A
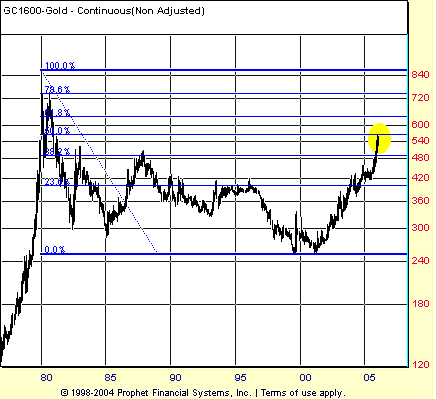
Writing recently in his legendary newsletter Dow Theory Letters about the prospect of higher gold prices in relation to his "50% principle," Richard Russell noted:Gold backed off literally at the halfway or 50 percent level of the great 1980 to 2000 bear market decline. The BIG question, the CRUCIAL question, is whether gold can advance above 550 and then hold above 550. If gold can do that, then under my interpretation of the 50 percent principle, gold will be on its way to testing and eventually bettering the old bull market high of 850. |

|
| FIGURE 1: GOLD CONTINUOUS FUTURES, MONTHLY. The bull market in gold that began at the turn of the century approaches the 50% retracement level of its 1980–2000 bear market in the spring of 2006. |
| Graphic provided by: Prophet Financial, Inc. |
| |
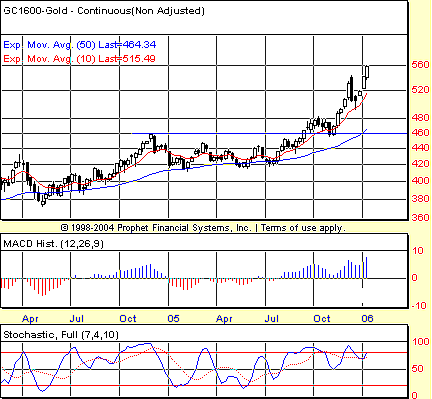
| My observations of gold, gold indexes, and mining shares are more modest, though the bullishness suggested in Russell's remarks find ample evidence on other time frames. Consider, for example, this chart of continuous gold futures (Figure 1). Note how after a consolidation that lasted for three and a half quarters (about 10.5 months), gold broke out above resistance at $460, rallied to $480, then pulled back to find support at the previous resistance level of 460. This kind of "don't look back" breakout (see my Working-Money.com article "Building A Better Breakout," August 1, 2003) is often a signal of great underlying strength. And the move in gold from early November 2005 through the first few weeks of January 2006 — a move that saw gold rally from 460 to 560 — is market strength personified. |

|
| FIGURE 2: GOLD CONTINUOUS FUTURES, WEEKLY. A DLB breakout late in the third quarter of 2005 makes a shallow pullback early in the fourth quarter before soaring higher as the year draws to a close. |
| Graphic provided by: Prophet Financial, Inc. |
| |
| In addition, note in Figure 2 the behavior of the moving average convergence/divergence (MACD) histogram. The pullback and reversal back to the upside in the fourth quarter of 2005 was a classic signal that this market was ready to move higher. The specific MACDH signal arrived on Friday, November 18 (for those following the weekly chart), signaling a bid at 500.50, which was filled two weeks later. More recently, the MACDH on the weekly chart is providing another signal, a bid in the wake of the price and MACDH pullback in mid-December. My Prophet.net chart shows a bid created by the weekly close on January 6 at 551.3, which was filled the following week. A more sensitive MACDH in my eSignal chart suggests a lower bid created a week earlier, as of the close on December 30. This lower bid was at 523.90. |
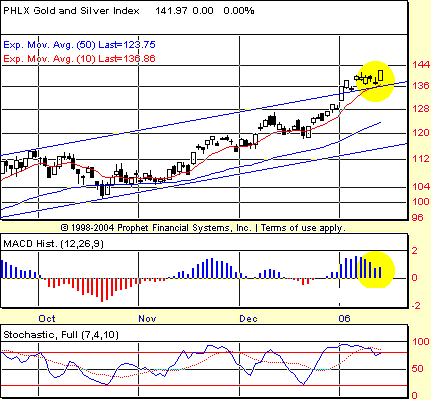
| The daily charts of gold and gold mining shares affirm the bullish outlook (Figure 3). Turning toward gold mining shares, which per our understanding of intermarket analysis tells us tends to lead the yellow metal, we see in the Philadelphia Gold and Silver Index ($XAU) a similar pullback and reversal in the MACDH. That this pullback and reversal appears to arrive as the index breaks out above the upper boundary of a trend channel that extends to the lows of May 2005 only makes it more worth watching for those looking to climb aboard the gold train before it makes its next move higher. |

|
| FIGURE 3: PHILADELPHIA GOLD & SILVER INDEX, DAILY. After breaking out above the upper boundary of a multimonth trend channel, the $XAU pulls back to test that former resistance level for support. |
| Graphic provided by: Prophet Financial, Inc. |
| |
| The price action seen in the $XAU is mirrored in a number of gold stocks including AU, BGO, CDE, DROOY, GFI, GSS, HMY, HL, NEM, PDG, and GOLD. I should point out that what has happened in the last few days is that a bid has been created in these stocks based on the MACDH, just as a bid has been created in the $XAU. In the $XAU, this bid is at 143.93. While bids from this method may or may not go unfilled and may or may not enjoy the sort of follow-through to the upside that turn bids into profitable positions, they nonetheless stand out as benchmarks — not unlike Richard Russell's 50% principle — that, if reached, speak both to achievement past as well as to the real potential of achievement yet to come. |
Technical Writer for Technical Analysis of STOCKS & COMMODITIES magazine, Working-Money.com, and Traders.com Advantage.
| Title: | Technical Writer |
| Company: | Technical Analysis, Inc. |
| Address: | 4757 California Avenue SW |
| Seattle, WA 98116 | |
| Phone # for sales: | 206 938 0570 |
| Fax: | 206 938 1307 |
| Website: | www.Traders.com |
| E-mail address: | DPenn@traders.com |
Traders' Resource Links | |
| Charting the Stock Market: The Wyckoff Method -- Books | |
| Working-Money.com -- Online Trading Services | |
| Traders.com Advantage -- Online Trading Services | |
| Technical Analysis of Stocks & Commodities -- Publications and Newsletters | |
| Working Money, at Working-Money.com -- Publications and Newsletters | |
| Traders.com Advantage -- Publications and Newsletters | |
| Professional Traders Starter Kit -- Software | |
Click here for more information about our publications!
Comments
Date: 01/17/06Rank: 5Comment:
Date: 01/24/06Rank: 4Comment:

Request Information From Our Sponsors
- StockCharts.com, Inc.
- Candle Patterns
- Candlestick Charting Explained
- Intermarket Technical Analysis
- John Murphy on Chart Analysis
- John Murphy's Chart Pattern Recognition
- John Murphy's Market Message
- MurphyExplainsMarketAnalysis-Intermarket Analysis
- MurphyExplainsMarketAnalysis-Visual Analysis
- StockCharts.com
- Technical Analysis of the Financial Markets
- The Visual Investor
- VectorVest, Inc.
- Executive Premier Workshop
- One-Day Options Course
- OptionsPro
- Retirement Income Workshop
- Sure-Fire Trading Systems (VectorVest, Inc.)
- Trading as a Business Workshop
- VectorVest 7 EOD
- VectorVest 7 RealTime/IntraDay
- VectorVest AutoTester
- VectorVest Educational Services
- VectorVest OnLine
- VectorVest Options Analyzer
- VectorVest ProGraphics v6.0
- VectorVest ProTrader 7
- VectorVest RealTime Derby Tool
- VectorVest Simulator
- VectorVest Variator
- VectorVest Watchdog
