HOT TOPICS LIST
- MACD
- Fibonacci
- RSI
- Gann
- ADXR
- Stochastics
- Volume
- Triangles
- Futures
- Cycles
- Volatility
- ZIGZAG
- MESA
- Retracement
- Aroon
INDICATORS LIST
LIST OF TOPICS
PRINT THIS ARTICLE
by Gary Grosschadl
It's been a sideways meander since 2003. In the short term, Microsoft's stock may challenge a trend shift.
Position: Hold
Gary Grosschadl
Independent Canadian equities trader and technical analyst based in Peterborough
Ontario, Canada.
PRINT THIS ARTICLE
ANDREWS PITCH-FORK
The Microsoft Outlook
01/16/06 10:07:53 AMby Gary Grosschadl
It's been a sideways meander since 2003. In the short term, Microsoft's stock may challenge a trend shift.
Position: Hold
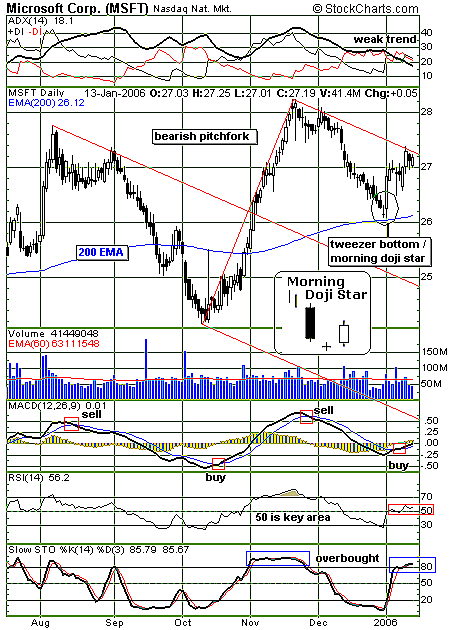
| On this daily chart (Figure 1), Microsoft shows an interesting support and resistance test via two converging lines. The stock hints at bullishness, having recently bounced off its 200-day exponential moving average (EMA), but a pitchfork view considers continued downside or at least sideways action. |
| The Andrews pitchfork, which was developed by Alan Andrews, uses three parallel lines drawn from three selected turning points. The parallel lines extending out to the right are used as normal support and resistance levels. The downward slant in this case is bearish, as price action tends to follow the direction of the fork's tines. The trend is broken with a sustained close above the upper median line, and then a new pitchfork is drawn with the turning points advanced by one. |

|
| FIGURE 1: MSFT, DAILY. Microsoft's daily chart shows converging lines of support and resistance. |
| Graphic provided by: StockCharts.com. |
| |
| Note the candlestick reversal pattern coming off the 200-period EMA support. It is a combination of a tweezer bottom and a morning doji star. A morning doji star reversal is typically a stronger or more reliable pattern than the more common version of a morning star where a small-bodied candle called a star takes the place of the doji (small cross). The question is, which is the stronger line -- the 200-period EMA support or the resistance of the upper median line of the pitchfork? |
| To determine which way this may resolve, several other indicators are examined. At the top of the chart, we see evidence of a weak trend via the falling ADX line (average directional movement index), currently 18.1. Also showing a bearish tendency is the stochastic oscillator (bottom of chart). Above 80 is considered an overbought situation, prone to a downleg once this oscillator falls below 80. Note that this oscillator can stay overbought in the presence of a strong ADX trend, as was the case last November. This is not the case now. The other two indicators have a bullish tone. The moving average convergence/divergence (MACD) indicator shows a bullish crossover. Provided that there is no stall at the zero line, an upleg is indicated. The relative strength index (RSI) also is deemed bullish as it is above the often key area of 50. |
| Should the stock close above the upper median line, a positive trend change could be surmised. Until that happens, expect another coming support test at the 200-period EMA. Should that fail to hold support, the next area of strong support would likely be at or near the center median line. |
Independent Canadian equities trader and technical analyst based in Peterborough
Ontario, Canada.
| Website: | www.whatsonsale.ca/financial.html |
| E-mail address: | gwg7@sympatico.ca |
Click here for more information about our publications!
Comments
Date: 01/17/06Rank: 5Comment:

Request Information From Our Sponsors
- StockCharts.com, Inc.
- Candle Patterns
- Candlestick Charting Explained
- Intermarket Technical Analysis
- John Murphy on Chart Analysis
- John Murphy's Chart Pattern Recognition
- John Murphy's Market Message
- MurphyExplainsMarketAnalysis-Intermarket Analysis
- MurphyExplainsMarketAnalysis-Visual Analysis
- StockCharts.com
- Technical Analysis of the Financial Markets
- The Visual Investor
- VectorVest, Inc.
- Executive Premier Workshop
- One-Day Options Course
- OptionsPro
- Retirement Income Workshop
- Sure-Fire Trading Systems (VectorVest, Inc.)
- Trading as a Business Workshop
- VectorVest 7 EOD
- VectorVest 7 RealTime/IntraDay
- VectorVest AutoTester
- VectorVest Educational Services
- VectorVest OnLine
- VectorVest Options Analyzer
- VectorVest ProGraphics v6.0
- VectorVest ProTrader 7
- VectorVest RealTime Derby Tool
- VectorVest Simulator
- VectorVest Variator
- VectorVest Watchdog
