HOT TOPICS LIST
- MACD
- Fibonacci
- RSI
- Gann
- ADXR
- Stochastics
- Volume
- Triangles
- Futures
- Cycles
- Volatility
- ZIGZAG
- MESA
- Retracement
- Aroon
INDICATORS LIST
LIST OF TOPICS
PRINT THIS ARTICLE
by Paolo Pezzutti
Ford Motor Co. stock is providing indications for at least a pause in the downtrend.
Position: Accumulate
Paolo Pezzutti
Author of the book "Trading the US Markets - A Comprehensive Guide to US Markets for International Traders and Investors" - Harriman House (July 2008)
PRINT THIS ARTICLE
ELLIOTT WAVE
Who Believes In Ford?
01/16/06 10:12:55 AMby Paolo Pezzutti
Ford Motor Co. stock is providing indications for at least a pause in the downtrend.
Position: Accumulate
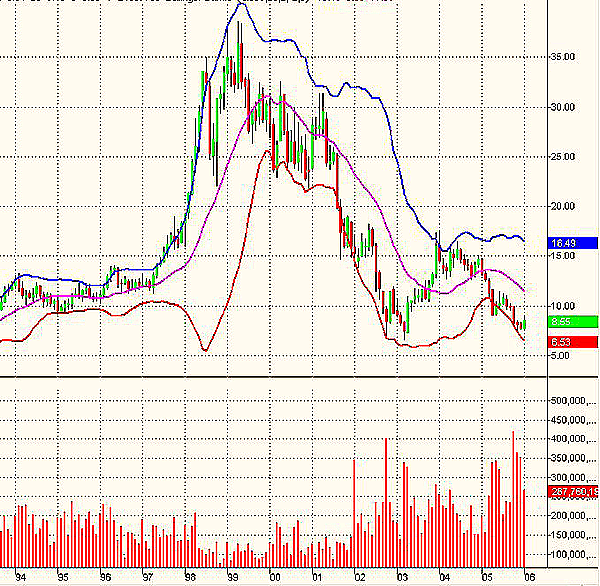
| Those who have invested in Ford (F) have been badly hurt during the past six years. Prices plunged from the top printed in 1999 at $38.63 to the March 2003 low of $6.58. Prices are now in the $8.50 area, below the 1994 levels (Figure 1). |

|
| FIGURE 1: FORD, MONTHLY. The stock printed a long downtrend with prices below 1994 levels. |
| Graphic provided by: TradeStation. |
| |
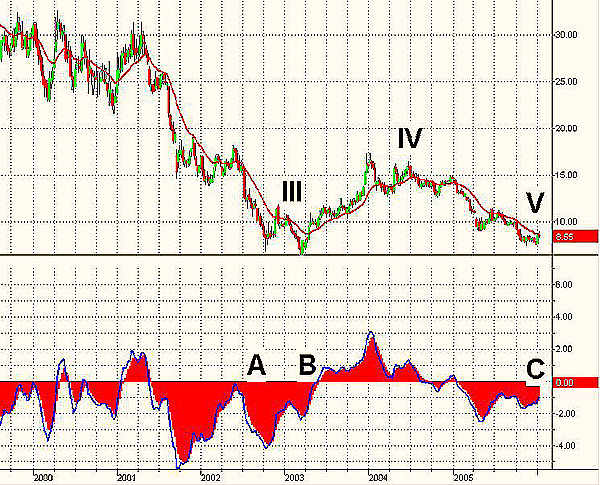
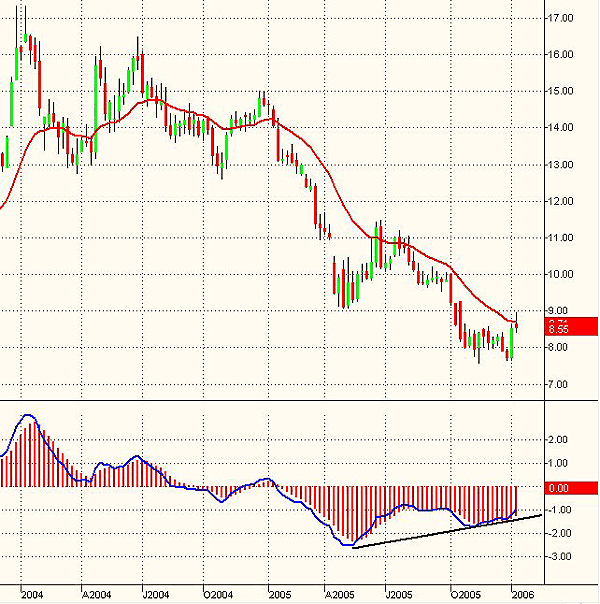
| The stock's behavior saw prices react from the March 2003 low to reach the $16 level in less than nine months, more than doubling its value. Since then, a long downtrend brought the stock very close to the previous lows. The interpretation of the ongoing Elliott wave count is displayed in Figure 2. Here, you can see that the 2003 low marks the end of wave III. Note that wave III had extensions that coincided with points A and B (divergences of the MACD). The following move shows how wave IV developed. The MACD (5,34,5), as suggested by Bill Williams in his book Trading Chaos, helps identify the beginning and the end of this corrective wave. Wave IV is characterized by the fact that the MACD moved up in positive territory. According to this reading of the wave patterns, Ford has been engaged in wave V since 2004. Point C indicates that the fifth wave of wave V should be over by now. Elliott wave counting does not provide unique interpretations. In addition, this wave could develop extensions to the downside. Note, however, that in case of a correct outcome of the analysis, this wave would be a failing or truncated fifth wave, providing additional force to an up reaction, developing in the form of an a-b-c- move. For sure, you can see that at the weekly level, the MACD has developed a significant positive divergence (Figure 3). |

|
| FIGURE 2: FORD, WEEKLY. According to the Elliott wave count proposed, the stock could be ready for an a-b-c move to the upside. |
| Graphic provided by: TradeStation. |
| |
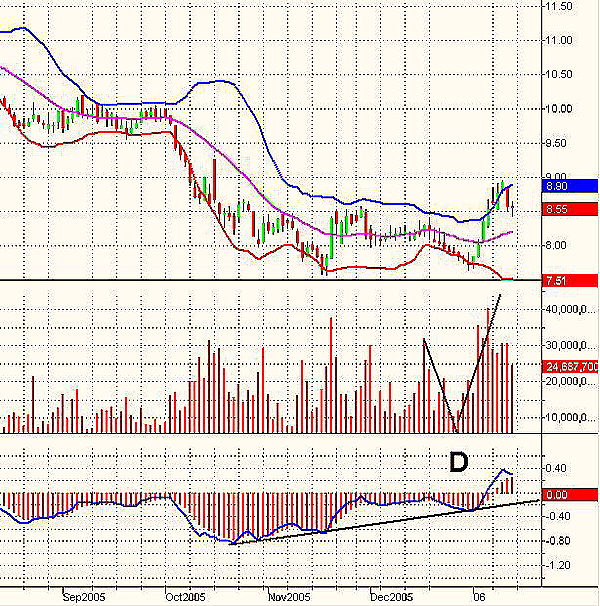
| In the daily time frame, the MACD has printed a positive divergence in coincidence with the November 17th low at $7.57. Last December, prices failed a retest of the previous low with the indicator still providing positive indications. In seven aggressive trading sessions, Ford moved from the $7.72 level to the high of $8.96 on January 11, 2006. Note that the Bollinger Bands opened nicely, indicating that an impulse to the upside is ongoing. Prices in the last two sessions have been consolidating from recent highs. The volumes during the last decline diminished (point D in Figure 4). Later, during the upmove, it increased to a peak that had not been reached since last May 2005. |

|
| FIGURE 3: FORD, WEEKLY. The MACD displays a positive divergence in coincidence with the November 2005 low. |
| Graphic provided by: TradeStation. |
| |
| Who believes in Ford? The news last week about the company's debt downgrading did not hurt. Technically speaking, the stock's condition has improved, providing indications for a follow-on move to the upside. Something seems to be changing in the investors' mood. Risk, however, is still high, both from the industrial and the technical perspective. Sometimes, it is from these situations that the big profits come. Therefore, if you want to consider a trade/investment in Ford, it is important to control your risk very strictly. |

|
| FIGURE 4: FORD, DAILY. In this time frame, the stock printed a positive MACD divergence. Volume together with the Bollinger Bands confirmed the impulse to the upside. |
| Graphic provided by: TradeStation. |
| |
Author of the book "Trading the US Markets - A Comprehensive Guide to US Markets for International Traders and Investors" - Harriman House (July 2008)
| Address: | VIA ROBERTO AGO 26 POSTAL CODE 00166 |
| Rome, ITALY | |
| Phone # for sales: | +393357540708 |
| E-mail address: | pezzutti.paolo@tiscali.it |
Click here for more information about our publications!
Comments
Date: 01/17/06Rank: 4Comment:

Request Information From Our Sponsors
- StockCharts.com, Inc.
- Candle Patterns
- Candlestick Charting Explained
- Intermarket Technical Analysis
- John Murphy on Chart Analysis
- John Murphy's Chart Pattern Recognition
- John Murphy's Market Message
- MurphyExplainsMarketAnalysis-Intermarket Analysis
- MurphyExplainsMarketAnalysis-Visual Analysis
- StockCharts.com
- Technical Analysis of the Financial Markets
- The Visual Investor
- VectorVest, Inc.
- Executive Premier Workshop
- One-Day Options Course
- OptionsPro
- Retirement Income Workshop
- Sure-Fire Trading Systems (VectorVest, Inc.)
- Trading as a Business Workshop
- VectorVest 7 EOD
- VectorVest 7 RealTime/IntraDay
- VectorVest AutoTester
- VectorVest Educational Services
- VectorVest OnLine
- VectorVest Options Analyzer
- VectorVest ProGraphics v6.0
- VectorVest ProTrader 7
- VectorVest RealTime Derby Tool
- VectorVest Simulator
- VectorVest Variator
- VectorVest Watchdog
