HOT TOPICS LIST
- MACD
- Fibonacci
- RSI
- Gann
- ADXR
- Stochastics
- Volume
- Triangles
- Futures
- Cycles
- Volatility
- ZIGZAG
- MESA
- Retracement
- Aroon
INDICATORS LIST
LIST OF TOPICS
PRINT THIS ARTICLE
by David Penn
A head & shoulders top threatens to send shares of Panera Bread Co. lower.
Position: N/A
David Penn
Technical Writer for Technical Analysis of STOCKS & COMMODITIES magazine, Working-Money.com, and Traders.com Advantage.
PRINT THIS ARTICLE
HEAD & SHOULDERS
Bread Breakdown
01/16/06 07:47:12 AMby David Penn
A head & shoulders top threatens to send shares of Panera Bread Co. lower.
Position: N/A
| One of my favorite television commercials involves the what can only be described as the "carbohydrate counterrevolution" as waged by fast-food franchise Jack in the Box. Starring "Jack," the franchise's fictional founder and increasingly popular "mascot," these commercials had the 6'8", 195-pound "Jack" leading an army of bakers on horseback, Braveheart-like, in a mock siege of "the bread bashers." "So let us make a toast — to toast!" Jack proclaims, as his baguette-wielding army charges across the screen. |

|
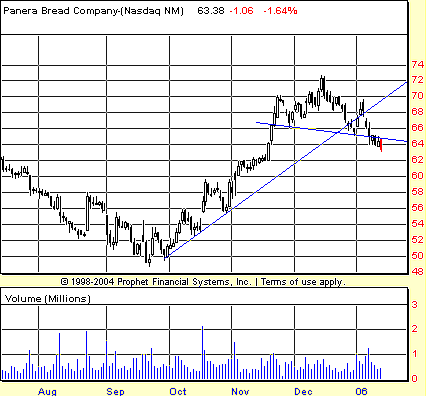
| FIGURE 1: PANERA BREAD CO., DAILY. A head & shoulders top in PNRA suggests a correction of some magnitude as prices break beneath the downwardly sloped neckline between 66 and 64. Note also the 1-2-3 test of the trendline. The break below the December low marked stage 3 of that 1-2-3 test. |
| Graphic provided by: Prophet Financial, Inc. |
| |
| Well, if Jack and his army had a hard time catching up with their quarry, then they might have better luck searching for "bread bashers" in the market for Panera Bread Co. (PNRA) stock. For after a great advance during the seasonal runup that began in the autumn of 2005 — a runup that saw PNRA climb from just under $50 a share to over $72 a share in about three months — it now appears as if the stock is well under way toward returning those gains whence they came. |
| As Figure 1 shows, the agent of the current correction appears to be a head & shoulders top. While this head & shoulders top in Panera — with its left shoulder developing in the second half of November, the head over the course of December, and its right shoulder over the first week of January — does not display well the characteristic volume patterns of head & shoulders tops (namely, the higher volume on the left side of the formation), in all other respects the pattern appears valid. With a high point of 72 and a low of 66 in this downwardly slanted head & shoulders top, traders should anticipate a minimum downside to at least 60 before the correction has run its course. |

|
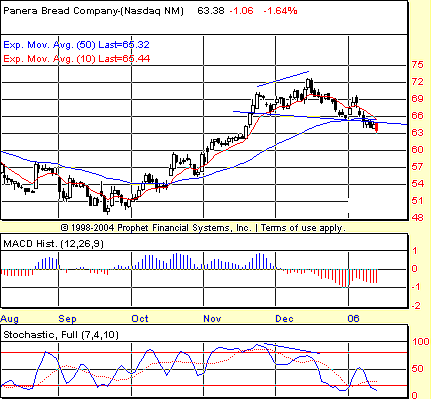
| FIGURE 2: PANERA BREAD CO., DAILY. The bearishness of the top in December was underscored by the negative divergence in the stochastic. |
| Graphic provided by: Prophet Financial, Inc. |
| |
| I've written frequently about how indicators like the moving average convergence/divergence (MACD) histogram and the stochastic can be used to complement signals provided by chart patterns. Here, a negative divergence in the stochastic occurs just as the "head" of the head & shoulders pattern is developing in December. Sometimes, the signals provided by indicators anticipate those from chart patterns, allowing aggressive traders to take partial positions ahead of potential breakouts and breakdowns, or simply alerting more cautious traders to the increased likelihood that a certain market move will occur. |
| Per my trading methodology, the negative divergence created an offer at 68.47 as of the close on December 15 (Figure 2). This offer was hit on December 20, on a day that closed with the trade in the money at 68.46. The maximum pain (MaxDD) occurred a day later, as PNRA closed at 69.86, leaving the trade down 2%. The decline resumed immediately afterward, however, with PNRA falling to a low close of 65.68 as the head of the pattern was completed. Even the bump in early January didn't take the trade into the red on a closing basis, and the action since then has gone the way of the sellers. |
Technical Writer for Technical Analysis of STOCKS & COMMODITIES magazine, Working-Money.com, and Traders.com Advantage.
| Title: | Technical Writer |
| Company: | Technical Analysis, Inc. |
| Address: | 4757 California Avenue SW |
| Seattle, WA 98116 | |
| Phone # for sales: | 206 938 0570 |
| Fax: | 206 938 1307 |
| Website: | www.Traders.com |
| E-mail address: | DPenn@traders.com |
Traders' Resource Links | |
| Charting the Stock Market: The Wyckoff Method -- Books | |
| Working-Money.com -- Online Trading Services | |
| Traders.com Advantage -- Online Trading Services | |
| Technical Analysis of Stocks & Commodities -- Publications and Newsletters | |
| Working Money, at Working-Money.com -- Publications and Newsletters | |
| Traders.com Advantage -- Publications and Newsletters | |
| Professional Traders Starter Kit -- Software | |
Click here for more information about our publications!
Comments
Date: 01/17/06Rank: 3Comment:

Request Information From Our Sponsors
- StockCharts.com, Inc.
- Candle Patterns
- Candlestick Charting Explained
- Intermarket Technical Analysis
- John Murphy on Chart Analysis
- John Murphy's Chart Pattern Recognition
- John Murphy's Market Message
- MurphyExplainsMarketAnalysis-Intermarket Analysis
- MurphyExplainsMarketAnalysis-Visual Analysis
- StockCharts.com
- Technical Analysis of the Financial Markets
- The Visual Investor
- VectorVest, Inc.
- Executive Premier Workshop
- One-Day Options Course
- OptionsPro
- Retirement Income Workshop
- Sure-Fire Trading Systems (VectorVest, Inc.)
- Trading as a Business Workshop
- VectorVest 7 EOD
- VectorVest 7 RealTime/IntraDay
- VectorVest AutoTester
- VectorVest Educational Services
- VectorVest OnLine
- VectorVest Options Analyzer
- VectorVest ProGraphics v6.0
- VectorVest ProTrader 7
- VectorVest RealTime Derby Tool
- VectorVest Simulator
- VectorVest Variator
- VectorVest Watchdog
