HOT TOPICS LIST
- MACD
- Fibonacci
- RSI
- Gann
- ADXR
- Stochastics
- Volume
- Triangles
- Futures
- Cycles
- Volatility
- ZIGZAG
- MESA
- Retracement
- Aroon
INDICATORS LIST
LIST OF TOPICS
PRINT THIS ARTICLE
by David Penn
A negative stochastic divergence confirms a breakdown from a rising wedge.
Position: N/A
David Penn
Technical Writer for Technical Analysis of STOCKS & COMMODITIES magazine, Working-Money.com, and Traders.com Advantage.
PRINT THIS ARTICLE
WEDGE FORMATIONS
The Dow Industrials' Hourly Rising Wedge Breakdown
01/13/06 10:14:20 AMby David Penn
A negative stochastic divergence confirms a breakdown from a rising wedge.
Position: N/A
| If there were a meme from the first week of January 2006, then it would be that stocks had moved "too far too fast." In most of my analysis, Tuesday, January 3, was a day when a lot of stocks were getting bids, and Friday, January 6, was a day when a lot of those bids were filled. The follow-through the following week on Monday, Tuesday, and Wednesday (January 9, 10, and 11) put a lot of those early-year trades nicely in the money. So it had to be expected that, sooner or later, those early birds would want to take their worms and go home. |

|
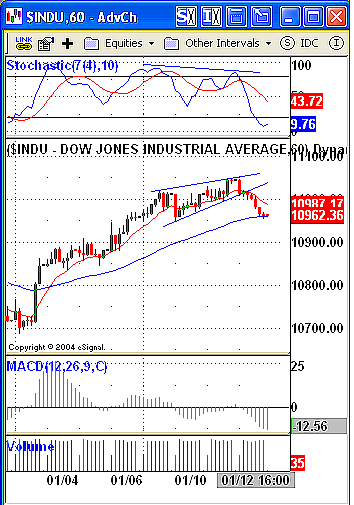
| FIGURE 1: DJIA, HOURLY. As a rising wedge developed over the second week of January 2006, a negative divergence in the stochastic hinted that the break from this pattern was likely to be in the downside. |
| Graphic provided by: eSignal. |
| |
The agent of the post-January 6th advance was a rising wedge, a chart pattern that comes in both bullish (falling) and bearish (rising) varieties (Figure 1). About rising wedges, Thomas Bulkowski writes in his Encyclopedia Of Chart Patterns:That is the major problem with wedges, whether rising or falling. You cannot find them. Not only are they rare, but also their spiraling price action seems hidden in a historical price series. A few stand out and shout "rising wedge," ... but most remain hidden like a raindrop joining a pond. |
| Bulkowski also suggests that, in addition to the pair of upsloping trendlines and multiple touches, rising wedges need to be at least three weeks in duration. The rising wedge I'm pointing out in the hourly Dow industrials is obviously not three weeks long. However, if you translate "three weeks" on a daily chart to its equivalent in an hourly chart, you could make the argument that rising wedges need to be at least 15 bars/candlesticks long (otherwise, suggests Bulkowski, the chart pattern is more likely a pennant). By this revised standard, the formation in the chart in Figure 1 can be considered a rising wedge as opposed to another pattern. |

|
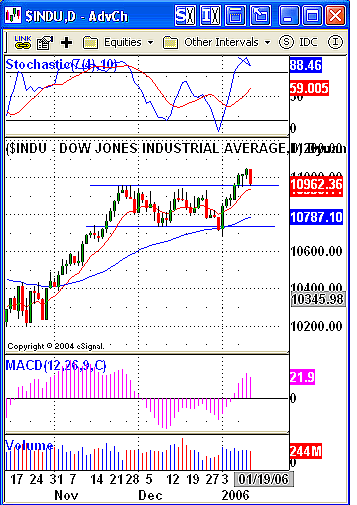
| FIGURE 2: DJIA, DAILY. The breakout in the second week in January suffers its first correction, but finds support at the precise level of the breakout. |
| Graphic provided by: eSignal. |
| |
| What are the breakdown implications for a rising wedge? According to Bulkowski, breakdowns from rising wedges "should decline ... to the start of the formation ... at a minimum." In the context of the rising wedge in the DJIA as shown in Figure 1, we can note that the minimum downside has been all but reached. What is particularly interesting about this downside is that this minimum move has found itself at both support at the 50-hour exponential moving average (EMA), as well as at the level of the breakout a few days previously. While this doesn't mean that this market won't correct further, it does put traders on notice that a significant test of support is at hand (Figure 2). |
| Should the industrials actually find support at current levels, then traders should be on guard for a resumption of the intermediate uptrend that began in earliest January. Specifically, adding the width of the consolidation from late November to early January — approximately 230 Dow points — to the value at the top of the consolidation — approximately 10950 — suggests a possible minimum upside of as much as 11180, some 130-odd points from the current January 2006 high. |
Technical Writer for Technical Analysis of STOCKS & COMMODITIES magazine, Working-Money.com, and Traders.com Advantage.
| Title: | Technical Writer |
| Company: | Technical Analysis, Inc. |
| Address: | 4757 California Avenue SW |
| Seattle, WA 98116 | |
| Phone # for sales: | 206 938 0570 |
| Fax: | 206 938 1307 |
| Website: | www.Traders.com |
| E-mail address: | DPenn@traders.com |
Traders' Resource Links | |
| Charting the Stock Market: The Wyckoff Method -- Books | |
| Working-Money.com -- Online Trading Services | |
| Traders.com Advantage -- Online Trading Services | |
| Technical Analysis of Stocks & Commodities -- Publications and Newsletters | |
| Working Money, at Working-Money.com -- Publications and Newsletters | |
| Traders.com Advantage -- Publications and Newsletters | |
| Professional Traders Starter Kit -- Software | |
Click here for more information about our publications!
Comments
Date: 01/14/06Rank: 3Comment:

Request Information From Our Sponsors
- StockCharts.com, Inc.
- Candle Patterns
- Candlestick Charting Explained
- Intermarket Technical Analysis
- John Murphy on Chart Analysis
- John Murphy's Chart Pattern Recognition
- John Murphy's Market Message
- MurphyExplainsMarketAnalysis-Intermarket Analysis
- MurphyExplainsMarketAnalysis-Visual Analysis
- StockCharts.com
- Technical Analysis of the Financial Markets
- The Visual Investor
- VectorVest, Inc.
- Executive Premier Workshop
- One-Day Options Course
- OptionsPro
- Retirement Income Workshop
- Sure-Fire Trading Systems (VectorVest, Inc.)
- Trading as a Business Workshop
- VectorVest 7 EOD
- VectorVest 7 RealTime/IntraDay
- VectorVest AutoTester
- VectorVest Educational Services
- VectorVest OnLine
- VectorVest Options Analyzer
- VectorVest ProGraphics v6.0
- VectorVest ProTrader 7
- VectorVest RealTime Derby Tool
- VectorVest Simulator
- VectorVest Variator
- VectorVest Watchdog
