HOT TOPICS LIST
- MACD
- Fibonacci
- RSI
- Gann
- ADXR
- Stochastics
- Volume
- Triangles
- Futures
- Cycles
- Volatility
- ZIGZAG
- MESA
- Retracement
- Aroon
INDICATORS LIST
LIST OF TOPICS
PRINT THIS ARTICLE
by Kanwaljit Singh Mauj
Magna Int'l is showing a falling trend, and further downside can't be ruled out.
Position: Sell
Kanwaljit Singh Mauj
He is a technical analyst based in Delhi, India, a post-graduate from the Indian Institute of Capital Markets (formerly the UTI Institute of Capital Markets), Mumbai. He follows the Indian markets as well the US markets very closely. He has been active in the capital markets for the past five years.
He is an associate with AGIP Securities, which specializes in money management, index futures, live chat for daytraders, and independent technical analysis consultancy. The company has a big media presence from the likes of CNBC, NDTV Profit, and ZEE Business.
PRINT THIS ARTICLE
ZIGZAG
Magna International: Lower Top, Lower Bottom
01/12/06 01:15:04 PMby Kanwaljit Singh Mauj
Magna Int'l is showing a falling trend, and further downside can't be ruled out.
Position: Sell
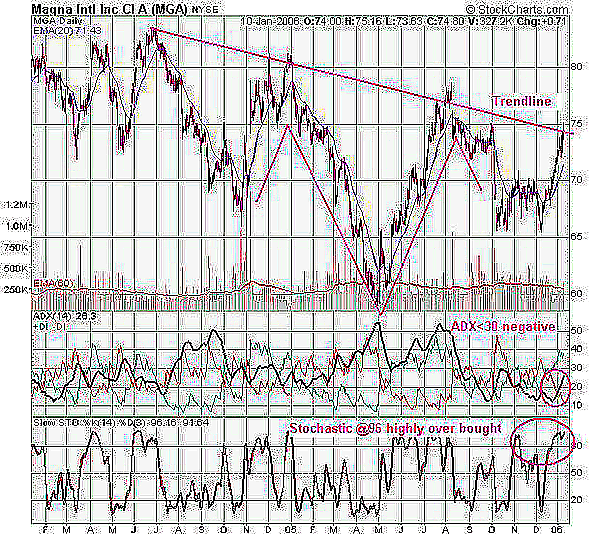
| A falling trend can be thought of as a falling resistance level -- the bears are in control and are pushing prices lower. |

|
| FIGURE 1: MAGNA INTL. Is a further downtrend in store for MGA? |
| Graphic provided by: StockCharts.com. |
| |
| In this scenario, prices try to penetrate the trendline but fail. This is well supported by such indicators used as average directional movement index (ADX) and the slow stochastic. Figure 1 shows a 14-day average directional Indicator (ADX), which is hovering around 20-25 levels. Until it crosses 30, there is no positive sign. In addition, the slow stochastic is at 90 or so, indicating the stock is in the highly overbought zone. A correction cannot be ruled out at this point. |
| We used a two-year period daily graph to show that the stock is trending south, as all support levels are breached. But to my understanding, it has already bottomed out at the 60 level, and an inverse head & shoulder formation can be seen. We will have to see if it will try to test the 80 level, which is a neckline for the inverse head & shoulder. Once this neckline is breached, we might see a target equal to the distance of the head from the neckline, which is $80-$60=$20. So it would be best not to enter the stock till the time it breaches the 80 level; it may be best to enter the stock at 82 for a $100 target. |
He is a technical analyst based in Delhi, India, a post-graduate from the Indian Institute of Capital Markets (formerly the UTI Institute of Capital Markets), Mumbai. He follows the Indian markets as well the US markets very closely. He has been active in the capital markets for the past five years.
He is an associate with AGIP Securities, which specializes in money management, index futures, live chat for daytraders, and independent technical analysis consultancy. The company has a big media presence from the likes of CNBC, NDTV Profit, and ZEE Business.
| Title: | Associate |
| Company: | AGIP Securities |
| Address: | C-735A, Sushant Lok-I |
| Gurgaon, Har | |
| Phone # for sales: | 98184-72389 |
| Website: | www.ashwanigujral.com |
| E-mail address: | contact@ashwanigujral.com |
Traders' Resource Links | |
| AGIP Securities has not added any product or service information to TRADERS' RESOURCE. | |
Click here for more information about our publications!
Comments
Date: 01/14/06Rank: 4Comment:

Request Information From Our Sponsors
- StockCharts.com, Inc.
- Candle Patterns
- Candlestick Charting Explained
- Intermarket Technical Analysis
- John Murphy on Chart Analysis
- John Murphy's Chart Pattern Recognition
- John Murphy's Market Message
- MurphyExplainsMarketAnalysis-Intermarket Analysis
- MurphyExplainsMarketAnalysis-Visual Analysis
- StockCharts.com
- Technical Analysis of the Financial Markets
- The Visual Investor
- VectorVest, Inc.
- Executive Premier Workshop
- One-Day Options Course
- OptionsPro
- Retirement Income Workshop
- Sure-Fire Trading Systems (VectorVest, Inc.)
- Trading as a Business Workshop
- VectorVest 7 EOD
- VectorVest 7 RealTime/IntraDay
- VectorVest AutoTester
- VectorVest Educational Services
- VectorVest OnLine
- VectorVest Options Analyzer
- VectorVest ProGraphics v6.0
- VectorVest ProTrader 7
- VectorVest RealTime Derby Tool
- VectorVest Simulator
- VectorVest Variator
- VectorVest Watchdog
