HOT TOPICS LIST
- MACD
- Fibonacci
- RSI
- Gann
- ADXR
- Stochastics
- Volume
- Triangles
- Futures
- Cycles
- Volatility
- ZIGZAG
- MESA
- Retracement
- Aroon
INDICATORS LIST
LIST OF TOPICS
PRINT THIS ARTICLE
by David Penn
As far as meaningful breakouts are concerned, you can't go home again.
Position: N/A
David Penn
Technical Writer for Technical Analysis of STOCKS & COMMODITIES magazine, Working-Money.com, and Traders.com Advantage.
PRINT THIS ARTICLE
BREAKOUTS
The Oil Service HOLDRS DLB Breakout
01/10/06 07:46:27 AMby David Penn
As far as meaningful breakouts are concerned, you can't go home again.
Position: N/A
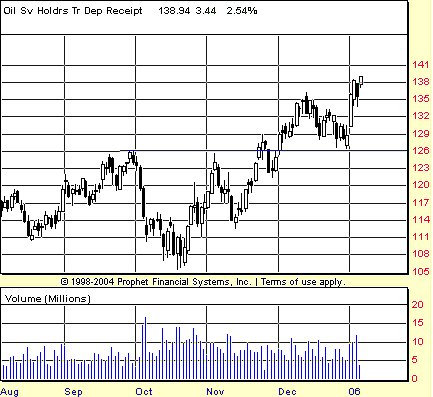
| A few years back I wrote an article for Working-Money.com that referred to the idea of "Don't Look Back" (DLB) breakouts ("Building A Better Breakout," August 1, 2003). That article used Donchian channels to introduce the idea that when prices break free from a consolidation, they will do one of two things: Either they will slip back below the breakout level, or they will continue to move forward. Moving forward, prices will fly to the upside or downside, but it is important to note that they will only find support (in the case of an upside breakout) or resistance (in the case of a downside breakdown) in the event of a pullback or bounce (Figure 1). |

|
| FIGURE 1: OIL SERVICE HOLDRS, DAILY. Oil service stocks, as measured by the OIH, broke out early in December at 126. Note how the pullback in the second half of the month found support precisely at that level before moving on to higher highs in January. |
| Graphic provided by: Prophet Financial, Inc. |
| |
| This creation of immediately tested support (or resistance) is what makes DLB breakouts so worthwhile. Often, when a market moves beyond a certain level, traders spend anxious minutes, hours, or days wondering whether the break will hold. In a DLB breakout, this question is answered relatively quickly, giving the trader or investor an extra sense of security insofar as the break level shows itself capable of enabling the move beyond it. |
| In the case of the oil service HOLDRS, OIH broke out at the beginning of December after a correction that lasted approximately two months. At the risk of getting ahead of myself, note that the size of the correction and the breakout level of 126 suggests a minimum upside (per Stan Weinstein's swing rule) of about 144. I note that here because the breakout in December saw OIH travel approximately half the distance to that minimum upside before rolling over near midmonth. And in rolling over, where did OIH find support, a place where bids were, apparently, abundant? At 126.55, merely 55 cents above the breakout level. (See Figure 2.) |

|
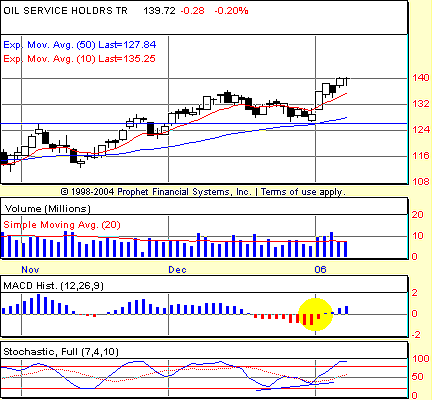
| FIGURE 2: OIL SERVICE HOLDRS, DAILY. A positive stochastic divergence and a positive shift higher in the MACD histogram were among the technical signals that emerged as OIH pulled back to test its breakout level for support. |
| Graphic provided by: Prophet Financial, Inc. |
| |
| From a swing trading perspective, DLB breakouts often come at excellent times. Although the actual entry price may not be much better when buying the dip created during a DLB pullback compared to buying the close of the breakout day (or, more accurately for most, buying the open of the day following the breakout day), such entries do tend to avoid the psychic and material pain of, for example, buying at 129, seeing prices rally to 135, then watching the market retreat back to 127. As you might imagine, there is plenty of time in such a buy-the-breakout approach for a less-sure trader to get spooked and find himself selling into a pullback. |
| Contrast that with an approach that is more swing trading in orientation, and that takes the DLB breakout into account. As OIH retreated toward the breakout level at 126, we note also a number of other technical factors. The presence of the 50-day exponential moving average (EMA) is one, and a positive stochastic divergence is another. The divergence signals a bid at 138.89 on January 3, which would have been filled on Friday, January 6. With a Monday close of 139.72, OIH bulls are in the money and watching for continued action higher. |
Technical Writer for Technical Analysis of STOCKS & COMMODITIES magazine, Working-Money.com, and Traders.com Advantage.
| Title: | Technical Writer |
| Company: | Technical Analysis, Inc. |
| Address: | 4757 California Avenue SW |
| Seattle, WA 98116 | |
| Phone # for sales: | 206 938 0570 |
| Fax: | 206 938 1307 |
| Website: | www.Traders.com |
| E-mail address: | DPenn@traders.com |
Traders' Resource Links | |
| Charting the Stock Market: The Wyckoff Method -- Books | |
| Working-Money.com -- Online Trading Services | |
| Traders.com Advantage -- Online Trading Services | |
| Technical Analysis of Stocks & Commodities -- Publications and Newsletters | |
| Working Money, at Working-Money.com -- Publications and Newsletters | |
| Traders.com Advantage -- Publications and Newsletters | |
| Professional Traders Starter Kit -- Software | |
Click here for more information about our publications!
Comments
Date: 01/10/06Rank: 3Comment:

Request Information From Our Sponsors
- VectorVest, Inc.
- Executive Premier Workshop
- One-Day Options Course
- OptionsPro
- Retirement Income Workshop
- Sure-Fire Trading Systems (VectorVest, Inc.)
- Trading as a Business Workshop
- VectorVest 7 EOD
- VectorVest 7 RealTime/IntraDay
- VectorVest AutoTester
- VectorVest Educational Services
- VectorVest OnLine
- VectorVest Options Analyzer
- VectorVest ProGraphics v6.0
- VectorVest ProTrader 7
- VectorVest RealTime Derby Tool
- VectorVest Simulator
- VectorVest Variator
- VectorVest Watchdog
- StockCharts.com, Inc.
- Candle Patterns
- Candlestick Charting Explained
- Intermarket Technical Analysis
- John Murphy on Chart Analysis
- John Murphy's Chart Pattern Recognition
- John Murphy's Market Message
- MurphyExplainsMarketAnalysis-Intermarket Analysis
- MurphyExplainsMarketAnalysis-Visual Analysis
- StockCharts.com
- Technical Analysis of the Financial Markets
- The Visual Investor
