HOT TOPICS LIST
- MACD
- Fibonacci
- RSI
- Gann
- ADXR
- Stochastics
- Volume
- Triangles
- Futures
- Cycles
- Volatility
- ZIGZAG
- MESA
- Retracement
- Aroon
INDICATORS LIST
LIST OF TOPICS
PRINT THIS ARTICLE
by Koos van der Merwe
The former energy advisor of US President George W. Bush predicts oil prices could reach as much as US$250 per barrel over the coming years.
Position: Accumulate
Koos van der Merwe
Has been a technical analyst since 1969, and has worked as a futures and options trader with First Financial Futures in Johannesburg, South Africa.
PRINT THIS ARTICLE
FLAGS AND PENNANTS
Rival Energy: A Play On Oil?
01/09/06 10:57:21 AMby Koos van der Merwe
The former energy advisor of US President George W. Bush predicts oil prices could reach as much as US$250 per barrel over the coming years.
Position: Accumulate
| Let us hope that Matthew Simmons, President Bush's former energy advisor, is wrong -- but if he is correct, then the best shares to buy other than oil stock will be those mines producing uranium. The chart here, however, is of Rival Energy, a junior energy company that will also benefit from rising oil prices (Figure 1). If the price of oil were to skyrocket to US$250 per barrel, this stock could explode in a similar manner. |
| Rival Energy Ltd. is a dynamic energy company focused on hydrocarbon exploration and production in western Canada. In 2003, the company completed a restructuring of Roseland Resources Ltd. and an acquisition of a shallow natural gas property in southwestern Saskatchewan, Canada. These transactions provided an initial base of production, reserves, and growth opportunities. The company is well positioned for significant expansion based on its healthy balance sheet and active drilling program. Sounds good, and the chart looks good. |

|
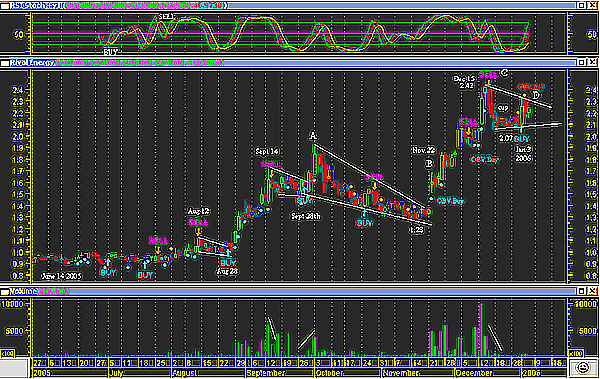
| FIGURE 1: RIVAL ENERGY ON THE TORONTO EXCHANGE. See how the price has risen from a low of Canadian $0.88 on June 14, 2005. |
| Graphic provided by: MetaStock. |
| |
| Figure 1 shows how the price has risen from a low of Canadian $0.88 on June 14, 2005. The first buy signals (blue dots) were triggered by on-balance volume (OBV), and confirmed on July 5 by the stochastic relative strength index (RSI) oscillator as the indicator moved above the 20 horizontal line. On July 20, it gave a buy signal once again, followed by a sell signal four days later. This sell signal was in spite of a rising share price as the oscillator moved from an overbought position. This sell signal could have disillusioned investors in spite of a rising oil price as volume stayed small. The astute technician, on the other hand, would have noticed the breakout flag pattern that developed upward on August 28, with the buy signal given by the indicator. They would also have noticed the increased volume soon confirmed by the OBV buy signals (blue dots). On September 14, the indicator gave a sell signal on falling volume, a sign of strength. This was confirmed by the single OBV buy (blue dot) four days later, and on September 28, on rising volume, the share price rose to a peak (A), the start of a pennant that broke upward 28 days later. The indicator did not give a sell signal, as it did not rise above and then fall below its 80 horizontal trigger. |
| A buy and sell signal was triggered during the formation of the pennant, but the low volume, confirmed by the OBV sell signals (orange dots), was a negative. On November 22, at B with much fanfare, the price jumped (a gap) and with rising volume triggered an OBV buy. The price rose rapidly to reach a high of $2.37 on December 15 at C. The chart shows that the price has now formed what could be a flag, or even a cup and handle pattern, with a possible breakout at D. The flag is suggesting a target of $3.21 (2.42 - 1.28 = 1.14 + 2.07 = 3.21). The indicator has given a buy signal on January 3, but this was followed soon after by an OBV sell signal at D. Volume fell as the share price fell, a sign of strength, but did not increase as the share price rose, which is a negative. To conclude, I would suggest that the more cautious investor wait for a breakout flag formation (cup pattern) at D. Those with a higher-risk profile and a long-term horizon could heed the words of Matthew Simmons and buy today. |
Has been a technical analyst since 1969, and has worked as a futures and options trader with First Financial Futures in Johannesburg, South Africa.
| Address: | 3256 West 24th Ave |
| Vancouver, BC | |
| Phone # for sales: | 6042634214 |
| E-mail address: | petroosp@gmail.com |
Click here for more information about our publications!
Comments
Date: 01/09/06Rank: 2Comment:
Date: 01/11/06Rank: 4Comment:

Request Information From Our Sponsors
- StockCharts.com, Inc.
- Candle Patterns
- Candlestick Charting Explained
- Intermarket Technical Analysis
- John Murphy on Chart Analysis
- John Murphy's Chart Pattern Recognition
- John Murphy's Market Message
- MurphyExplainsMarketAnalysis-Intermarket Analysis
- MurphyExplainsMarketAnalysis-Visual Analysis
- StockCharts.com
- Technical Analysis of the Financial Markets
- The Visual Investor
- VectorVest, Inc.
- Executive Premier Workshop
- One-Day Options Course
- OptionsPro
- Retirement Income Workshop
- Sure-Fire Trading Systems (VectorVest, Inc.)
- Trading as a Business Workshop
- VectorVest 7 EOD
- VectorVest 7 RealTime/IntraDay
- VectorVest AutoTester
- VectorVest Educational Services
- VectorVest OnLine
- VectorVest Options Analyzer
- VectorVest ProGraphics v6.0
- VectorVest ProTrader 7
- VectorVest RealTime Derby Tool
- VectorVest Simulator
- VectorVest Variator
- VectorVest Watchdog
