HOT TOPICS LIST
- MACD
- Fibonacci
- RSI
- Gann
- ADXR
- Stochastics
- Volume
- Triangles
- Futures
- Cycles
- Volatility
- ZIGZAG
- MESA
- Retracement
- Aroon
INDICATORS LIST
LIST OF TOPICS
PRINT THIS ARTICLE
by David Penn
A bearish engulfing candlestick puts an emphatic cap on gains in Sirius Satellite.
Position: N/A
David Penn
Technical Writer for Technical Analysis of STOCKS & COMMODITIES magazine, Working-Money.com, and Traders.com Advantage.
PRINT THIS ARTICLE
CANDLESTICK CHARTING
Stern Warning
01/06/06 07:35:33 AMby David Penn
A bearish engulfing candlestick puts an emphatic cap on gains in Sirius Satellite.
Position: N/A
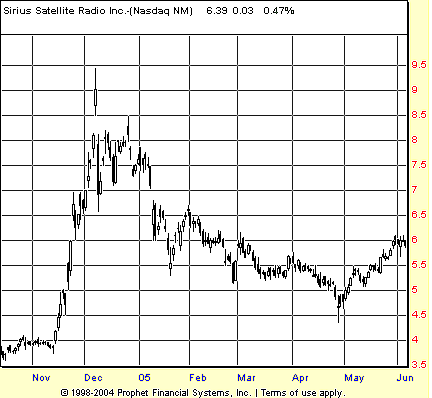
| Back in March 2005, I wrote a piece for Traders.com Advantage wondering whether the similarities between the daily price action of Sirius Satellite (SIRI) and the weekly price action of gold circa the early 1980s meant that the former was headed for the same bear market hell as the latter. The article was titled "Sirius Satellite: Map Of A Mania?" (March 22, 2005). |

|
| FIGURE 1: SIRIUS SATELLITE, DAILY. After spiking in December 2004, shares of SIRI went into a virtual nosedive over the following five months, shaving fully 50% of its value by late April 2005. |
| Graphic provided by: Prophet Financial, Inc. |
| |
| The mania was real, but the warning of the mania came late insofar as the stock managed to bottom a little over a month after my piece on Sirius was posted. And what has the stock done since? After bottoming near 4.5 in April, Sirius rallied to the 7 level by early July and slipped into a relatively wide and sloppy trading range between 6 and 7.5 (with occasional excursions as high as 8) (Figure 1). |
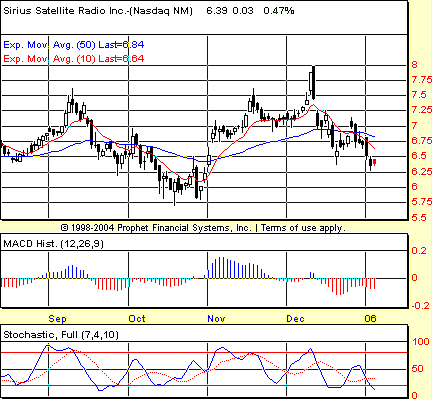
| Trading ranges have a reputation for being difficult to trade, and depending on the range provided and the style of the trader trying to trade it, this can certainly be the case. There were clear moves in Sirius in recent months that traders could have taken advantage of to their benefit, however. The most recent of such moves arrived in the autumn of 2005: a decline from just under 8 to just over 6 heralded by negative divergences in the stochastic and MACD histogram, as well as a massive bearish engulfing candlestick (Figure 2). |

|
| FIGURE 2: SIRIUS SATELLITE, DAILY. A bearish engulfing candlestick in early December 2005 confirmed the bearishness of negative divergences in both the stochastic and the MACD histogram. |
| Graphic provided by: Prophet Financial, Inc. |
| |
| The bearish engulfing candlestick pattern looks more or less how it sounds. The candlestick is a dark one, reflecting a closing price that was lower than the open, and features a price range that encompasses or "engulfs" the entirety of the previous -- generally bullish -- candlestick. While such patterns are significant enough on their own, when bearish engulfing candlesticks appear on the second peak of negative divergences, the message they bring is all the more worth paying attention to -- if not heeding outright. |
| What can be said of the decline in Sirius right now? Moving into January 2006, SIRI's moving average convergence/divergence (MACD) histogram has yet to make a lower low vis-a-vis December. This keeps the door open to the possibility that the histogram will create a positive divergence, hinting of a waning momentum to the downside. On the other hand, the stochastic has already made a lower low vis-a-vis its position in December, effectively ruling out the possibility of a positive divergence for the time being. Taken together, these indicators seem to suggest that those who are looking to load up on some serious Sirius stock may have the opportunity to do so at lower levels -- perhaps even as low as the October lows near 5.75. |
Technical Writer for Technical Analysis of STOCKS & COMMODITIES magazine, Working-Money.com, and Traders.com Advantage.
| Title: | Technical Writer |
| Company: | Technical Analysis, Inc. |
| Address: | 4757 California Avenue SW |
| Seattle, WA 98116 | |
| Phone # for sales: | 206 938 0570 |
| Fax: | 206 938 1307 |
| Website: | www.Traders.com |
| E-mail address: | DPenn@traders.com |
Traders' Resource Links | |
| Charting the Stock Market: The Wyckoff Method -- Books | |
| Working-Money.com -- Online Trading Services | |
| Traders.com Advantage -- Online Trading Services | |
| Technical Analysis of Stocks & Commodities -- Publications and Newsletters | |
| Working Money, at Working-Money.com -- Publications and Newsletters | |
| Traders.com Advantage -- Publications and Newsletters | |
| Professional Traders Starter Kit -- Software | |
Click here for more information about our publications!
Comments
Date: 01/06/06Rank: 3Comment:

Request Information From Our Sponsors
- VectorVest, Inc.
- Executive Premier Workshop
- One-Day Options Course
- OptionsPro
- Retirement Income Workshop
- Sure-Fire Trading Systems (VectorVest, Inc.)
- Trading as a Business Workshop
- VectorVest 7 EOD
- VectorVest 7 RealTime/IntraDay
- VectorVest AutoTester
- VectorVest Educational Services
- VectorVest OnLine
- VectorVest Options Analyzer
- VectorVest ProGraphics v6.0
- VectorVest ProTrader 7
- VectorVest RealTime Derby Tool
- VectorVest Simulator
- VectorVest Variator
- VectorVest Watchdog
- StockCharts.com, Inc.
- Candle Patterns
- Candlestick Charting Explained
- Intermarket Technical Analysis
- John Murphy on Chart Analysis
- John Murphy's Chart Pattern Recognition
- John Murphy's Market Message
- MurphyExplainsMarketAnalysis-Intermarket Analysis
- MurphyExplainsMarketAnalysis-Visual Analysis
- StockCharts.com
- Technical Analysis of the Financial Markets
- The Visual Investor
