HOT TOPICS LIST
- MACD
- Fibonacci
- RSI
- Gann
- ADXR
- Stochastics
- Volume
- Triangles
- Futures
- Cycles
- Volatility
- ZIGZAG
- MESA
- Retracement
- Aroon
INDICATORS LIST
LIST OF TOPICS
PRINT THIS ARTICLE
by Paolo Pezzutti
Continental Airlines stock has been in a strong uptrend for the last two months, more than doubling its price.
Position: N/A
Paolo Pezzutti
Author of the book "Trading the US Markets - A Comprehensive Guide to US Markets for International Traders and Investors" - Harriman House (July 2008)
PRINT THIS ARTICLE
TECHNICAL ANALYSIS
Continental Airlines Flies High
01/05/06 10:05:19 AMby Paolo Pezzutti
Continental Airlines stock has been in a strong uptrend for the last two months, more than doubling its price.
Position: N/A
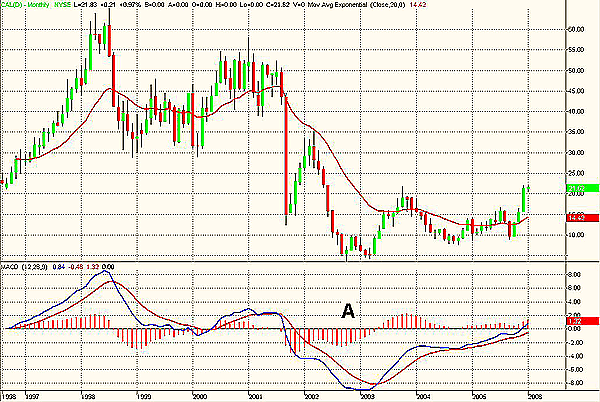
| Continental Airlines (CAL) reported very good results related to the December 2005 operations; in fact, the stock has gained more than 2% in the past few days. Since last October, however, prices started a tremendous uptrend, more than doubling from $9 to $21 in two months! If you look at the long-term chart (Figure 1), as I usually do to get a sense of the "big picture," you will see that the stock reached its all-time high back in 1998 when it touched the $65 level. That's still very far from the present level. The 2000 top, typical for most of the stocks, was lower than that at $55. The September 2001 saw prices plunge to the $15 level, only to see new lower lows in October 2002 at $3.60! Continental has been moving in an uptrend during the past three years. In this case, the savvy investors who entered long positions in 2002, when pessimism around airline companies was at the top, have been rewarded exceptionally well, with the stock now printing the $21.60 level. In Figure 1 (point A), you can see how the moving average convergence/divergence (MACD) printed a significant (for those who trusted it) positive divergence in coincidence with the 2002 low. Since then, the MACD has been rising and above its moving average, but always remaining in negative territories. It reached positive values only in December 2005. Prices now are testing the October 2003 highs. The stock has been volatile throughout the period, printing sharp upmoves and then consolidating significantly for long times. Not an easy environment. |

|
| FIGURE 1: CONTINENTAL, MONTHLY. CAL stock is testing the October 2003 high. |
| Graphic provided by: TradeStation. |
| |
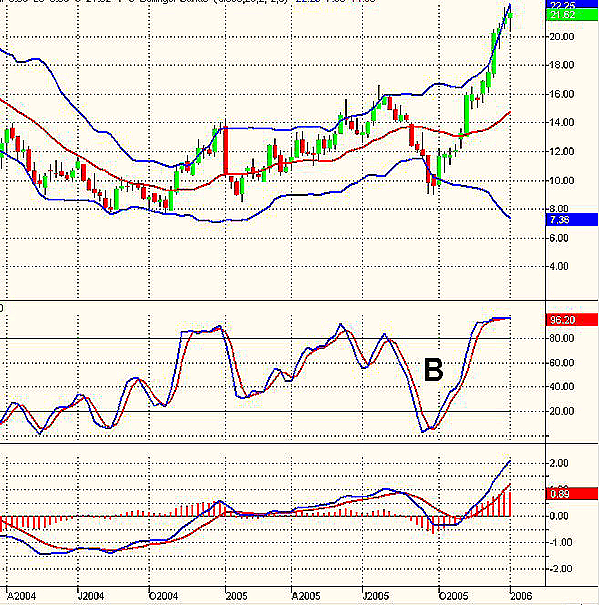
| The weekly chart in Figure 2 confirms the indications provided in the higher time frame. After a fast retracement ended in September 2005 at $9, prices started the ongoing upmove. The stochastic gave a correct entry signal at the time, and now it is overbought. The MACD is positive and rising, with prices that are very far from their moving average. The Bollinger Bands are still opening and indicate that a strong impulse to the upside is being printed. |

|
| FIGURE 2: CONTINENTAL, WEEKLY. An impulse to the upside is being printed. |
| Graphic provided by: TradeStation. |
| |
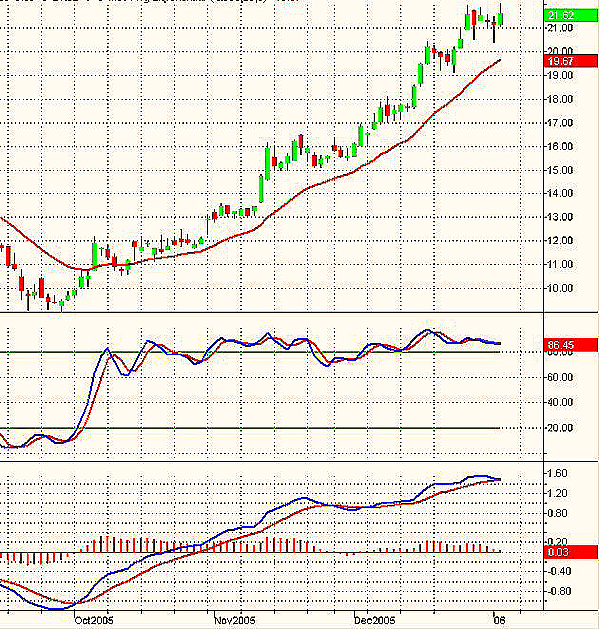
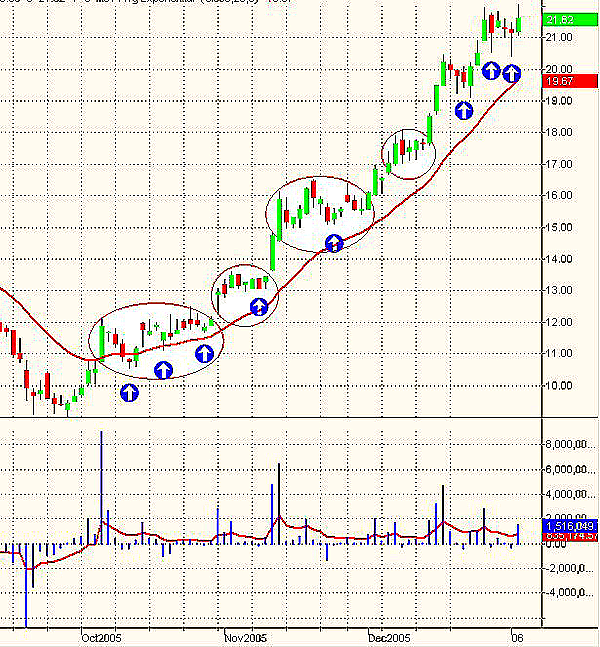
| The daily chart displays the dream of traders and investors (Figure 3) -- a steep and stable uptrend without a deep correction. The stochastic is overbought and the MACD followed the uptrend nicely. The upmove has been characterized by fast and short expansions followed by consolidations and congestions. The pullbacks lasted a few days when they occurred. In this environment, the force index - force index = volume * (close-close of the previous day) -- works well, providing low-risk entries (blue arrows) (Figure 4). The force index is normally smoothed with a two-day exponential moving average (EMA) because the raw indicator appears very jagged. It pays to buy when the two-day EMA of the indicator is negative. A 13-day EMA of the force index provides indications about the longer-term trend. When it is positive, it means that bulls are in control. The two-day EMA of the force index is used to pinpoint buying and selling opportunities. You will spot an entry point when the two-day EMA of the force index is negative, placing a buy order above the high of that day. You can see that the indicator has been very efficient in these conditions, providing excellent indications. |

|
| FIGURE 3: CONTINENTAL, DAILY. The stock printed a tremendous uptrend during the past two months. |
| Graphic provided by: TradeStation. |
| |
| But how long can this trend last? It is difficult to say. These phases can last for a long time. If you want to jump on the running horse, you should try to do so, controlling your risk. It is important to find a suitable entry point where this can be done more easily. You do not want to be the last one left to buy! Sharp corrections could occur at any time, with weak long hands accelerating the selloff. |

|
| FIGURE 4: CONTINENTAL, DAILY. The force index provided good entry points during the uptrend. |
| Graphic provided by: TradeStation. |
| |
Author of the book "Trading the US Markets - A Comprehensive Guide to US Markets for International Traders and Investors" - Harriman House (July 2008)
| Address: | VIA ROBERTO AGO 26 POSTAL CODE 00166 |
| Rome, ITALY | |
| Phone # for sales: | +393357540708 |
| E-mail address: | pezzutti.paolo@tiscali.it |
Click here for more information about our publications!
Comments
Date: 01/05/06Rank: 3Comment:
Date: 01/11/06Rank: 4Comment: very good technical analysis

Request Information From Our Sponsors
- StockCharts.com, Inc.
- Candle Patterns
- Candlestick Charting Explained
- Intermarket Technical Analysis
- John Murphy on Chart Analysis
- John Murphy's Chart Pattern Recognition
- John Murphy's Market Message
- MurphyExplainsMarketAnalysis-Intermarket Analysis
- MurphyExplainsMarketAnalysis-Visual Analysis
- StockCharts.com
- Technical Analysis of the Financial Markets
- The Visual Investor
- VectorVest, Inc.
- Executive Premier Workshop
- One-Day Options Course
- OptionsPro
- Retirement Income Workshop
- Sure-Fire Trading Systems (VectorVest, Inc.)
- Trading as a Business Workshop
- VectorVest 7 EOD
- VectorVest 7 RealTime/IntraDay
- VectorVest AutoTester
- VectorVest Educational Services
- VectorVest OnLine
- VectorVest Options Analyzer
- VectorVest ProGraphics v6.0
- VectorVest ProTrader 7
- VectorVest RealTime Derby Tool
- VectorVest Simulator
- VectorVest Variator
- VectorVest Watchdog
