HOT TOPICS LIST
- MACD
- Fibonacci
- RSI
- Gann
- ADXR
- Stochastics
- Volume
- Triangles
- Futures
- Cycles
- Volatility
- ZIGZAG
- MESA
- Retracement
- Aroon
INDICATORS LIST
LIST OF TOPICS
PRINT THIS ARTICLE
by Arthur Hill
NYBOT cotton has formed an ascending triangle, and a resistance challenge looks imminent.
Position: Accumulate
Arthur Hill
Arthur Hill is currently editor of TDTrader.com, a website specializing in trading strategies, sector/industry specific breadth stats and overall technical analysis. He passed the Society of Technical Analysts (STA London) diploma exam with distinction is a Certified Financial Technician (CFTe). Prior to TD Trader, he was the Chief Technical Analyst for Stockcharts.com and the main contributor to the ChartSchool.
PRINT THIS ARTICLE
ASCENDING TRIANGLES
Cotton Ready To Climb
01/05/06 07:39:13 AMby Arthur Hill
NYBOT cotton has formed an ascending triangle, and a resistance challenge looks imminent.
Position: Accumulate
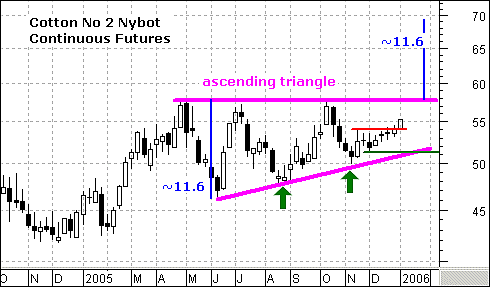
| Figure 1, a continuous futures chart for NYBOT No. 2 cotton, shows that prices surged at the beginning of 2005 and then consolidated for the rest of the year. Cotton advanced from 42.4 to 57.59 (January-April) and then pulled back to 46.1 in early June. Despite two more rally attempts, cotton stalled at 58 in July and October. Cotton has essentially gone nowhere the last nine to 10 months. |

|
| FIGURE 1: NYBOT COTTON. Prices surged at the beginning of 2005 before eventually stalling. |
| Graphic provided by: MetaStock. |
| Graphic provided by: MS QuoteCenter. |
| |
| Even though cotton failed to break resistance at 58 twice and traded flat most of 2005, a bullish continuation pattern formed over the last six to seven months. Note the higher lows in August and November (green arrows). When combined with the equal highs, an ascending triangle formed and a break above 58 would have signaled a continuation higher. The equal highs represented overhead supply and selling pressure. The higher lows showed shallower dips as buying pressure came in at higher prices. The pattern would be confirmed with a break above the resistance highs. |
| Cotton started 2006 off with a bang and broke above its November and December highs. This solidifies the last reaction low, and the next challenge is ascending triangle resistance. A break above this level would project further strength toward 69-70. The width of the pattern is added to the breakout for an upside target (57.8 - 46.1 = 11.7, 57.8 = 11.7 = 69.5). A move below the lower trendline and December low (51) would question the validity of this pattern. |
Arthur Hill is currently editor of TDTrader.com, a website specializing in trading strategies, sector/industry specific breadth stats and overall technical analysis. He passed the Society of Technical Analysts (STA London) diploma exam with distinction is a Certified Financial Technician (CFTe). Prior to TD Trader, he was the Chief Technical Analyst for Stockcharts.com and the main contributor to the ChartSchool.
| Title: | Editor |
| Company: | TDTrader.com |
| Address: | Willem Geetsstraat 17 |
| Mechelen, B2800 | |
| Phone # for sales: | 3215345465 |
| Website: | www.tdtrader.com |
| E-mail address: | arthurh@tdtrader.com |
Traders' Resource Links | |
| TDTrader.com has not added any product or service information to TRADERS' RESOURCE. | |
Click here for more information about our publications!
Comments
Date: 01/05/06Rank: 3Comment:

|

Request Information From Our Sponsors
- StockCharts.com, Inc.
- Candle Patterns
- Candlestick Charting Explained
- Intermarket Technical Analysis
- John Murphy on Chart Analysis
- John Murphy's Chart Pattern Recognition
- John Murphy's Market Message
- MurphyExplainsMarketAnalysis-Intermarket Analysis
- MurphyExplainsMarketAnalysis-Visual Analysis
- StockCharts.com
- Technical Analysis of the Financial Markets
- The Visual Investor
- VectorVest, Inc.
- Executive Premier Workshop
- One-Day Options Course
- OptionsPro
- Retirement Income Workshop
- Sure-Fire Trading Systems (VectorVest, Inc.)
- Trading as a Business Workshop
- VectorVest 7 EOD
- VectorVest 7 RealTime/IntraDay
- VectorVest AutoTester
- VectorVest Educational Services
- VectorVest OnLine
- VectorVest Options Analyzer
- VectorVest ProGraphics v6.0
- VectorVest ProTrader 7
- VectorVest RealTime Derby Tool
- VectorVest Simulator
- VectorVest Variator
- VectorVest Watchdog
