HOT TOPICS LIST
- MACD
- Fibonacci
- RSI
- Gann
- ADXR
- Stochastics
- Volume
- Triangles
- Futures
- Cycles
- Volatility
- ZIGZAG
- MESA
- Retracement
- Aroon
INDICATORS LIST
LIST OF TOPICS
PRINT THIS ARTICLE
by David Penn
While most stocks slid sideways in December 2005, pharmaceutical stocks -- as measured by the PPH -- soared.
Position: N/A
David Penn
Technical Writer for Technical Analysis of STOCKS & COMMODITIES magazine, Working-Money.com, and Traders.com Advantage.
PRINT THIS ARTICLE
GAPS
Better Living Through Chemistry
01/04/06 01:33:31 PMby David Penn
While most stocks slid sideways in December 2005, pharmaceutical stocks -- as measured by the PPH -- soared.
Position: N/A
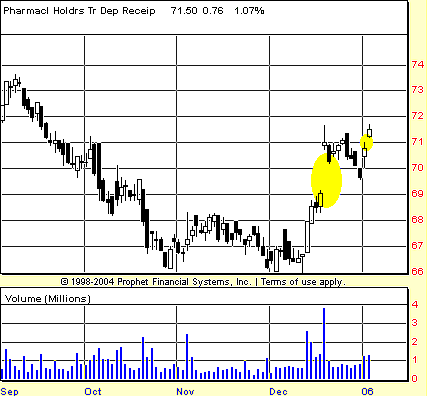
| In a caption for my last look at pharmaceutical stocks for Traders.com Advantage ("Falling Pharmaceuticals," November 30, 2005), I noted that a "bounce in November looks ready to test the bear market lows in December." This test, or more to the point, the possibility of a successful test of the lows, was the brightest star in an otherwise dark sky for pharmaceutical stocks. Indeed, I noted near the end of that article that "increasingly, it appears as if something more than a cyclical calamity is responsible for the agonies of these stocks." |

|
| FIGURE 1: PHARMACEUTICAL HOLDRS, DAILY. Gaps in the PPH's December rally suggest an abundance of buying strength. Note also the piercing pattern in early December and the hammer candlestick six days later just before the high-volume moves higher begin. |
| Graphic provided by: Prophet Financial, Inc. |
| |
| Agony, smagony. Days after "Falling Pharmaceuticals" was posted, the PPH was showing signs that reports of its demise were more than a tad premature (Figure 1). Although true strength in the PPH would not be evident until mid-December, technical signs -- including a piercing pattern and a hammer -- helped underscore the shift in sentiment toward the drug stocks. |
| How do we know that sentiment was actually shifting in favor of the pharmaceuticals? I always remind myself that rather than being little more than the reading of tea leaves, technical analysis is nothing more than a translation of human behavior. In other words, the patterns on a chart are merely abstractions drawn from the participation of hundred of thousands of buyers and sellers in a free marketplace. |

|
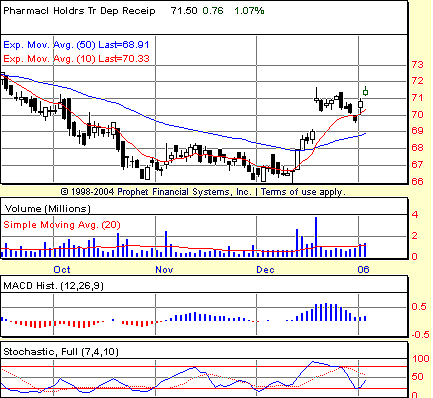
| FIGURE 2: PHARMACEUTICAL HOLDRS, DAILY. The strong MACD histogram in mid-December suggests that the price highs that correspond with it will be exceeded before the PPH's rally is complete. |
| Graphic provided by: Prophet Financial, Inc. |
| |
| So when we see a piercing pattern on a chart, a bullish reversal pattern in which a market opens below the low in a recent downtrend yet closes significantly higher, we should think less about the "pattern" and more about what the pattern actually describes. The same is true about the hammer pattern that appears a little over a week later in the PPH near mid-December. Taken together, these patterns show lessened enthusiasm on the part of sellers and increased commitment and motivation on the part of buyers. |
| Going forward, what can traders and speculators expect from pharmaceutical stocks? The most bullish aspects of the current move in these stocks are the gaps -- one in mid-December and another early in January. These gaps suggest pent-up buying strength on the part of market participants who are more than willing and ready to "buy high and sell higher." In addition, bullishness is hinted by the size of the moving average convergence/divergence (MACD) histogram in December (Figure 2). It is likely (though, of course, not assured) that the current rally will not peak until the price extremes that accompanied the MACD histogram peak are exceeded. With those price extremes recently exceeded on January 3, the upside may be more limited now than it was a week ago. But for the moment, the upside appears still in evidence. |
Technical Writer for Technical Analysis of STOCKS & COMMODITIES magazine, Working-Money.com, and Traders.com Advantage.
| Title: | Technical Writer |
| Company: | Technical Analysis, Inc. |
| Address: | 4757 California Avenue SW |
| Seattle, WA 98116 | |
| Phone # for sales: | 206 938 0570 |
| Fax: | 206 938 1307 |
| Website: | www.Traders.com |
| E-mail address: | DPenn@traders.com |
Traders' Resource Links | |
| Charting the Stock Market: The Wyckoff Method -- Books | |
| Working-Money.com -- Online Trading Services | |
| Traders.com Advantage -- Online Trading Services | |
| Technical Analysis of Stocks & Commodities -- Publications and Newsletters | |
| Working Money, at Working-Money.com -- Publications and Newsletters | |
| Traders.com Advantage -- Publications and Newsletters | |
| Professional Traders Starter Kit -- Software | |
Click here for more information about our publications!
Comments
Date: 01/05/06Rank: 5Comment:
Date: 01/05/06Rank: 3Comment:

Request Information From Our Sponsors
- StockCharts.com, Inc.
- Candle Patterns
- Candlestick Charting Explained
- Intermarket Technical Analysis
- John Murphy on Chart Analysis
- John Murphy's Chart Pattern Recognition
- John Murphy's Market Message
- MurphyExplainsMarketAnalysis-Intermarket Analysis
- MurphyExplainsMarketAnalysis-Visual Analysis
- StockCharts.com
- Technical Analysis of the Financial Markets
- The Visual Investor
- VectorVest, Inc.
- Executive Premier Workshop
- One-Day Options Course
- OptionsPro
- Retirement Income Workshop
- Sure-Fire Trading Systems (VectorVest, Inc.)
- Trading as a Business Workshop
- VectorVest 7 EOD
- VectorVest 7 RealTime/IntraDay
- VectorVest AutoTester
- VectorVest Educational Services
- VectorVest OnLine
- VectorVest Options Analyzer
- VectorVest ProGraphics v6.0
- VectorVest ProTrader 7
- VectorVest RealTime Derby Tool
- VectorVest Simulator
- VectorVest Variator
- VectorVest Watchdog
