HOT TOPICS LIST
- MACD
- Fibonacci
- RSI
- Gann
- ADXR
- Stochastics
- Volume
- Triangles
- Futures
- Cycles
- Volatility
- ZIGZAG
- MESA
- Retracement
- Aroon
INDICATORS LIST
LIST OF TOPICS
PRINT THIS ARTICLE
by Han Kim
To get a better sense of where the security's price is headed, you should consider volume along with price changes. Price changes are viewed with more significance when the volume accompanying the change is high, and conversely with less significance when the volume is low.
Position: Buy
Han Kim
Traders.com Advantage Staff Writer
PRINT THIS ARTICLE
The Power Of Price And Volume Trends
08/15/00 10:47:02 AMby Han Kim
To get a better sense of where the security's price is headed, you should consider volume along with price changes. Price changes are viewed with more significance when the volume accompanying the change is high, and conversely with less significance when the volume is low.
Position: Buy
| How do you account for variance in volume on a price chart? By using an indicator such as the price and volume trend (PVT). PVT takes the relative change in price of the security, multiplies the accompanying volume, then adds the value from the previous PVT. Here's how to calculate PVT: C = Today's Close YC = Yesterday's Close V = Today's Volume YPVT = Yesterday's PVT PVT = (((C - YC) / YC) * V) + YPVT |
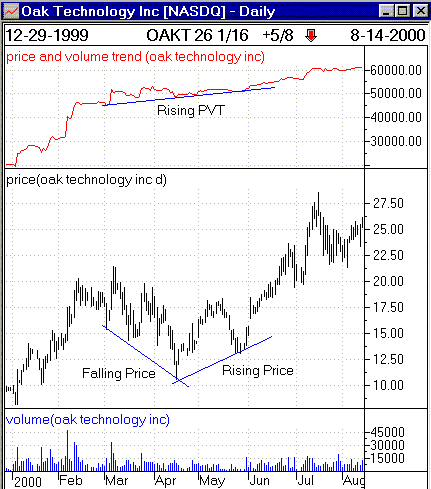
| The general trend of the PVT tells you whether money is flowing in or out of a security. Below is an example of PVT applied to Oak Technology Inc. [OAKT]. In March and April the PVT trendline was clearly on the rise while prices were falling. This divergence indicates that prices were falling on relatively small volumes. Notice that price started to rise again and continued to do so as the PVT continued to rise. |

|
| A falling price trend during a rising PVT leads to a rally that will last as long as the PVT continues to rise. |
| Graphic provided by: WindowOnWallstreet. |
| |
| In this particular case, the PVT continued to rise indicating that money was still flowing into OAKT. As a result, the prices continued to go up. In conclusion, by using PVT to confirm major trends you will be taking into consideration the magnitude of both the change in price and the corresponding volume. |
Traders.com Advantage Staff Writer
| Title: | Webmaster |
| Company: | Technical Analysis, Inc. |
| Address: | 4757 California AVE SW |
| Seattle, WA 98116 | |
| Phone # for sales: | 206-938-0570 |
| Fax: | 206-938-1307 |
| Website: | www.traders.com |
| E-mail address: | hkim@traders.com |
Traders' Resource Links | |
| Charting the Stock Market: The Wyckoff Method -- Books | |
| Working-Money.com -- Online Trading Services | |
| Traders.com Advantage -- Online Trading Services | |
| Technical Analysis of Stocks & Commodities -- Publications and Newsletters | |
| Working Money, at Working-Money.com -- Publications and Newsletters | |
| Traders.com Advantage -- Publications and Newsletters | |
| Professional Traders Starter Kit -- Software | |
Click here for more information about our publications!
Comments
Date: / /Rank: 5Comment:

Request Information From Our Sponsors
- StockCharts.com, Inc.
- Candle Patterns
- Candlestick Charting Explained
- Intermarket Technical Analysis
- John Murphy on Chart Analysis
- John Murphy's Chart Pattern Recognition
- John Murphy's Market Message
- MurphyExplainsMarketAnalysis-Intermarket Analysis
- MurphyExplainsMarketAnalysis-Visual Analysis
- StockCharts.com
- Technical Analysis of the Financial Markets
- The Visual Investor
- VectorVest, Inc.
- Executive Premier Workshop
- One-Day Options Course
- OptionsPro
- Retirement Income Workshop
- Sure-Fire Trading Systems (VectorVest, Inc.)
- Trading as a Business Workshop
- VectorVest 7 EOD
- VectorVest 7 RealTime/IntraDay
- VectorVest AutoTester
- VectorVest Educational Services
- VectorVest OnLine
- VectorVest Options Analyzer
- VectorVest ProGraphics v6.0
- VectorVest ProTrader 7
- VectorVest RealTime Derby Tool
- VectorVest Simulator
- VectorVest Variator
- VectorVest Watchdog
