HOT TOPICS LIST
- MACD
- Fibonacci
- RSI
- Gann
- ADXR
- Stochastics
- Volume
- Triangles
- Futures
- Cycles
- Volatility
- ZIGZAG
- MESA
- Retracement
- Aroon
INDICATORS LIST
LIST OF TOPICS
PRINT THIS ARTICLE
by David Penn
On the penultimate day of bulllish seasonals, the market sends shorts scurrying for the exits.
Position: N/A
David Penn
Technical Writer for Technical Analysis of STOCKS & COMMODITIES magazine, Working-Money.com, and Traders.com Advantage.
PRINT THIS ARTICLE
DAY TRADING
Rally In Your Eye
01/04/06 09:07:47 AMby David Penn
On the penultimate day of bulllish seasonals, the market sends shorts scurrying for the exits.
Position: N/A
| Conventional wisdom suggests that the "Santa Claus rally" actually consists of the last five days of the year-end and the first two days of the year beginning. And after the sharp, short-covering rally on the first trading day of 2006, I can't help but wonder if bulls really believe that "late" is better than "never." |

|
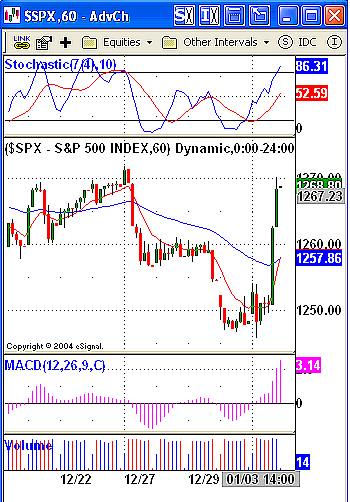
| FIGURE 1: S&P 500, HOURLY. When the divergence in the stochastic is confirmed by a divergence in the MACD histogram, the signal provided is often best not ignored. |
| Graphic provided by: eSignal. |
| |
| Since I went into 2006 short the QQQQ, the bearishness of the market that had existed since at least mid-December was not lost on me. Insofar as I use specific entry signals, it makes a difference to me how coherent those signals are when they appear. By "coherent," I mean how close to "textbook" the entry signals are. For me, the fact that the market had looked weak for several days, yet my sell signals appeared hard to come by up until just recently, encouraged me to think that any move to the downside that started immediately might end up being short-lived. |
| This concern was heightened when I looked at my hourly chart of the $SPX after yesterday's close (Figure 1). Oddly enough, my Prophet.net chart did not show the same positive stochastic divergence in the hourly Standard & Poor's 500 that appeared in my eSignal chart of the same. But the positive stochastic divergence was plain in the latter -- and a positive divergence in the moving average convergence/divergence (MACD) histogram was evident in charts from both sources. And while I won't pretend to have expected the 100-plus day in the Dow Jones Industrial Average that took place, it was evident that the market on Tuesday was going to be higher at some point -- it was just a matter of how high. |

|
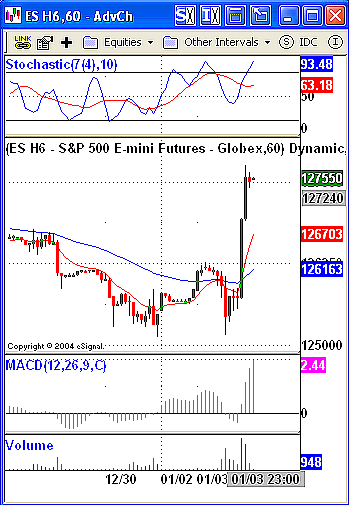
| FIGURE 2: MARCH EMINI S&P 500, HOURLY. Positive divergences in the stochastic and MACD histogram on the last trading day of December signaled the bullishness of the first trading day of January. |
| Graphic provided by: eSignal. |
| |
| Some sense of "how high" might have been gained by looking from the S&P 500 cash to the S&P 500 futures -- specifically, the emini S&P 500 March futures. We can see the positive divergences that formed in late December as the futures drifted lower and lower. Those divergences indeed marked a bottom -- though it was a bottom that was severely tested late in the morning of the first trading day of 2006. However, there was no lower low in price; the positive divergence that was signaled in late December held, and by the afternoon, the market was soaring higher. See Figure 2. |
| Stan Weinstein's swing rule provided for an initial upside in the futures of about 1274.25. We compute this by taking the low on December 30 at 1251.25 and subtracting it from the value at the swing point, that point being the high (in this case of a breakout to the upside) between the December 30th low and the January 3rd low. This 11.5 range is then added to the value at the swing point (1262.75) for a minimum upside of 1274.25. The emini S&P 500, basis March, closed at 1275.50, after climbing as high as 1277.50. |
Technical Writer for Technical Analysis of STOCKS & COMMODITIES magazine, Working-Money.com, and Traders.com Advantage.
| Title: | Technical Writer |
| Company: | Technical Analysis, Inc. |
| Address: | 4757 California Avenue SW |
| Seattle, WA 98116 | |
| Phone # for sales: | 206 938 0570 |
| Fax: | 206 938 1307 |
| Website: | www.Traders.com |
| E-mail address: | DPenn@traders.com |
Traders' Resource Links | |
| Charting the Stock Market: The Wyckoff Method -- Books | |
| Working-Money.com -- Online Trading Services | |
| Traders.com Advantage -- Online Trading Services | |
| Technical Analysis of Stocks & Commodities -- Publications and Newsletters | |
| Working Money, at Working-Money.com -- Publications and Newsletters | |
| Traders.com Advantage -- Publications and Newsletters | |
| Professional Traders Starter Kit -- Software | |
Click here for more information about our publications!
Comments
Date: 01/05/06Rank: 3Comment:

Request Information From Our Sponsors
- VectorVest, Inc.
- Executive Premier Workshop
- One-Day Options Course
- OptionsPro
- Retirement Income Workshop
- Sure-Fire Trading Systems (VectorVest, Inc.)
- Trading as a Business Workshop
- VectorVest 7 EOD
- VectorVest 7 RealTime/IntraDay
- VectorVest AutoTester
- VectorVest Educational Services
- VectorVest OnLine
- VectorVest Options Analyzer
- VectorVest ProGraphics v6.0
- VectorVest ProTrader 7
- VectorVest RealTime Derby Tool
- VectorVest Simulator
- VectorVest Variator
- VectorVest Watchdog
- StockCharts.com, Inc.
- Candle Patterns
- Candlestick Charting Explained
- Intermarket Technical Analysis
- John Murphy on Chart Analysis
- John Murphy's Chart Pattern Recognition
- John Murphy's Market Message
- MurphyExplainsMarketAnalysis-Intermarket Analysis
- MurphyExplainsMarketAnalysis-Visual Analysis
- StockCharts.com
- Technical Analysis of the Financial Markets
- The Visual Investor
