

HOT TOPICS LIST
- MACD
- Fibonacci
- RSI
- Gann
- ADXR
- Stochastics
- Volume
- Triangles
- Futures
- Cycles
- Volatility
- ZIGZAG
- MESA
- Retracement
- Aroon
INDICATORS LIST
LIST OF TOPICS
PRINT THIS ARTICLE
by Paolo Pezzutti
In the intermediate term, the utilities sector could benefit from the end of the rate hikes.
Position: Accumulate
Paolo Pezzutti
Author of the book "Trading the US Markets - A Comprehensive Guide to US Markets for International Traders and Investors" - Harriman House (July 2008)
PRINT THIS ARTICLE
MACD
Dow Jones Utilities Index And Positive Expectations
01/03/06 01:54:52 PMby Paolo Pezzutti
In the intermediate term, the utilities sector could benefit from the end of the rate hikes.
Position: Accumulate
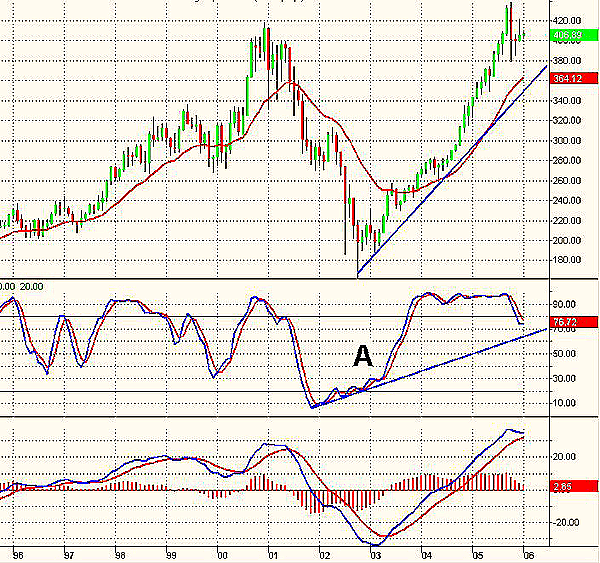
| After reaching a high of 418 in 2000, the Dow Jones Utilities Index ($UTIL) hit a low of 162 in 2002. In the three years since, however, the index has performed well, reaching the present 406 level. The 2002 low was hit with a positive divergence (point A) of the stochastic slow and the moving average convergence/divergence (MACD) red histogram. In three years, prices more than doubled, but after hitting new highs in September 2005, the index plunged the following month. This wide-ranging bar indicates at least a pause in the uptrend. You can see this situation displayed clearly (Figure 1). The stochastic left the overbought area after two years. The MACD red histogram is turning down, although the MACD has not yet crossed its moving average. |
|
| FIGURE 1: UTILITIES INDEX, MONTHLY. The index managed to return to the levels of the 2000 top. |
| Graphic provided by: TradeStation. |
| |
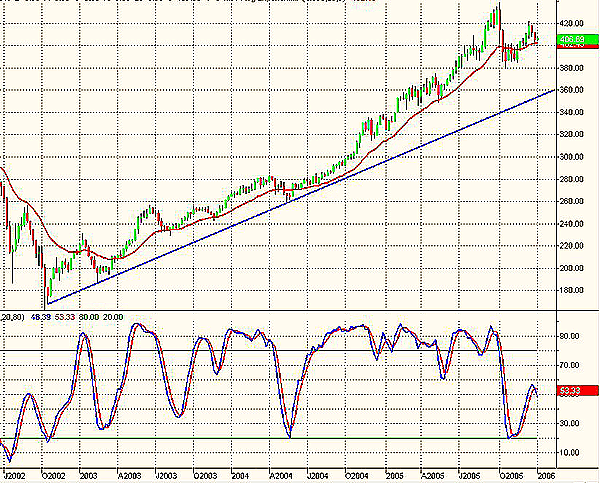
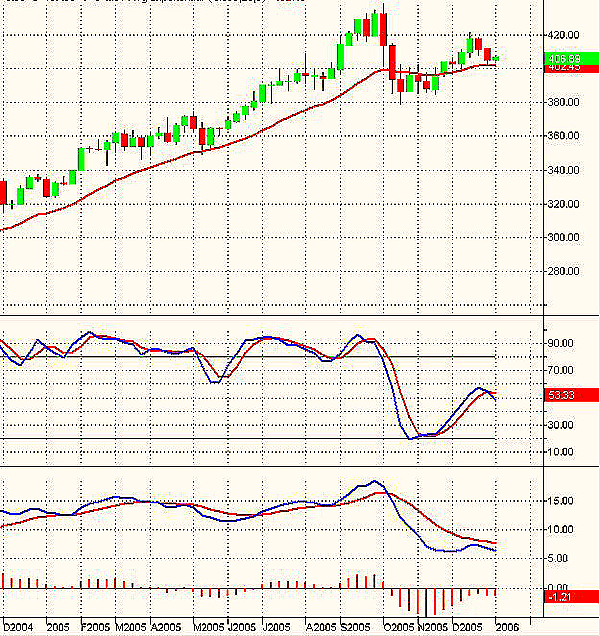
| Figure 2 displays the tremendous uptrend that started in 2002. This trend developed smoothly without deep corrections. The stochastic managed to reach the oversold area only in May 2004 and during the still-ongoing correction last October. Prices are now consolidating to new support levels, however. They have lost directionality and are now moving sideways. Both the stochastic and MACD are negatively inclined, confirming the ongoing consolidation phase (Figure 3). |
|
| FIGURE 2: UTILITIES INDEX, WEEKLY. In this time frame, a smooth and stable uptrend brought prices to new highs. |
| Graphic provided by: TradeStation. |
| |
|
| FIGURE 3: UTILITIES INDEX, WEEKLY. Prices are consolidating from recent highs. |
| Graphic provided by: TradeStation. |
| |
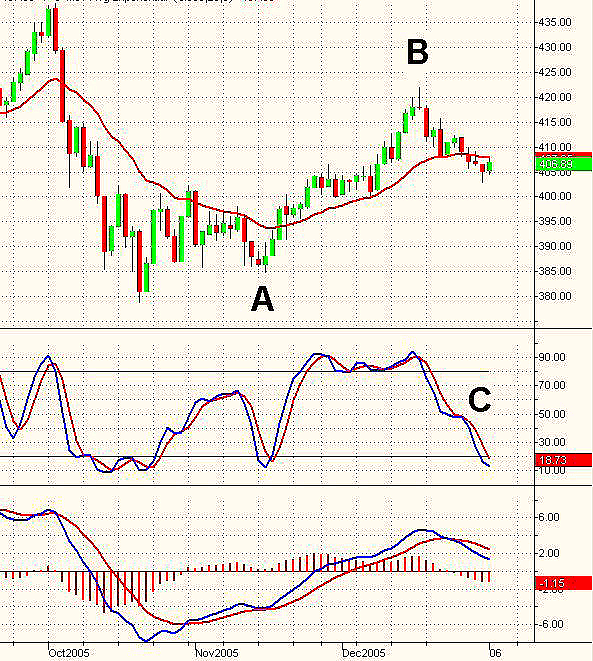
| The daily time frame in Figure 4 displays how prices on November 25 printed a relative low, correctly signaled by the stochastic (point A). Since then, the prices moved up and printed the December 16th reversal top (point B) when the ongoing correction started. The stochastic has now reached the oversold area (point C) while the MACD is still moving down. In the long term, the utilities index is a valid alternative to growth strategies. The end of the interest rate hike series in 2006 could favor this sector. When the hikes will actually end, however, is still a mystery; analysts believe this will happen some time in 2006. Technically, the index is still in a correction/consolidation mode, and this is evident in all time frames. In the medium term, this phase could still last several weeks. It could be premature to fully commit to an upside movement at this stage. I would look to identify short-term reversal formations to accumulate long positions during the next months. |
|
| FIGURE 4: UTILITIES INDEX, DAILY. The index is moving into a correction phase in search of a support level. |
| Graphic provided by: TradeStation. |
| |
Author of the book "Trading the US Markets - A Comprehensive Guide to US Markets for International Traders and Investors" - Harriman House (July 2008)
| Address: | VIA ROBERTO AGO 26 POSTAL CODE 00166 |
| Rome, ITALY | |
| Phone # for sales: | +393357540708 |
| E-mail address: | pezzutti.paolo@tiscali.it |
Click here for more information about our publications!
Comments
Date:�01/05/06Rank:�3Comment:�

Request Information From Our Sponsors
- StockCharts.com, Inc.
- Candle Patterns
- Candlestick Charting Explained
- Intermarket Technical Analysis
- John Murphy on Chart Analysis
- John Murphy's Chart Pattern Recognition
- John Murphy's Market Message
- MurphyExplainsMarketAnalysis-Intermarket Analysis
- MurphyExplainsMarketAnalysis-Visual Analysis
- StockCharts.com
- Technical Analysis of the Financial Markets
- The Visual Investor
- VectorVest, Inc.
- Executive Premier Workshop
- One-Day Options Course
- OptionsPro
- Retirement Income Workshop
- Sure-Fire Trading Systems (VectorVest, Inc.)
- Trading as a Business Workshop
- VectorVest 7 EOD
- VectorVest 7 RealTime/IntraDay
- VectorVest AutoTester
- VectorVest Educational Services
- VectorVest OnLine
- VectorVest Options Analyzer
- VectorVest ProGraphics v6.0
- VectorVest ProTrader 7
- VectorVest RealTime Derby Tool
- VectorVest Simulator
- VectorVest Variator
- VectorVest Watchdog