HOT TOPICS LIST
- MACD
- Fibonacci
- RSI
- Gann
- ADXR
- Stochastics
- Volume
- Triangles
- Futures
- Cycles
- Volatility
- ZIGZAG
- MESA
- Retracement
- Aroon
INDICATORS LIST
LIST OF TOPICS
PRINT THIS ARTICLE
by David Penn
Divergences in the MACD histogram and stochastic accompany a test of the 61.8% retracement of the $HGX July-October decline.
Position: N/A
David Penn
Technical Writer for Technical Analysis of STOCKS & COMMODITIES magazine, Working-Money.com, and Traders.com Advantage.
PRINT THIS ARTICLE
MACD
Housing And Histograms
01/03/06 01:21:30 PMby David Penn
Divergences in the MACD histogram and stochastic accompany a test of the 61.8% retracement of the $HGX July-October decline.
Position: N/A
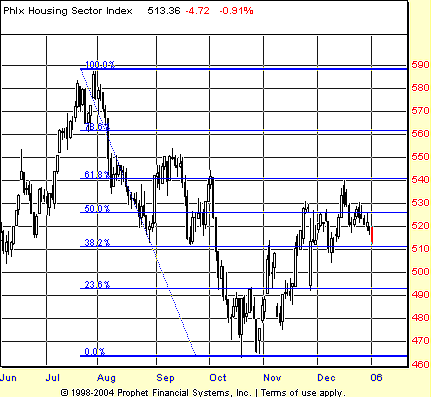
| Summer declines and autumn bounces ... if the stocks that make up the Philadelphia Housing Sector Index ($HGX) could have their behavior in the second half of 2005 summed up in one phrase, then that might be the phrase (Figure 1). |

|
| FIGURE 1: PHILADELPHIA HOUSING SECTOR INDEX, DAILY. The autumn bounce in the $HGX retraced fully 61.8% of the summer declines. |
| Graphic provided by: Prophet Financial, Inc. |
| |
| Those housing bears that have been waiting for a collapse in the housing market -- or, at least, in the stock market -- couldn't have been more heartened by the trading in these stocks during the summer and early autumn of 2005. From the end of July to mid-October, these stocks as measured by the $HGX fell some 20%. Some of the component stocks of the $HGX, stocks like Hovnanian and MDC Holdings, suffered even steeper losses over the same period. |
| Housing stocks did rally in the autumn, along with a broader market that included new all-time highs for the transportation average and new, multiyear highs for the Standard & Poor's 500. But the bullishness in the $HGX appears to have been capped by resistance at the 61.8% retracement level just south of 540. Aside from the Fibonacci aspect of this level, it shouldn't be too surprising that the $HGX might run into some difficulty as it attempted to rise above 540. There was potential resistance in the form of past peaks (that is, the end of September/beginning of October high just shy of 545), as well as in the bottom of the consolidation range in the first half of September. See Figure 2. |

|
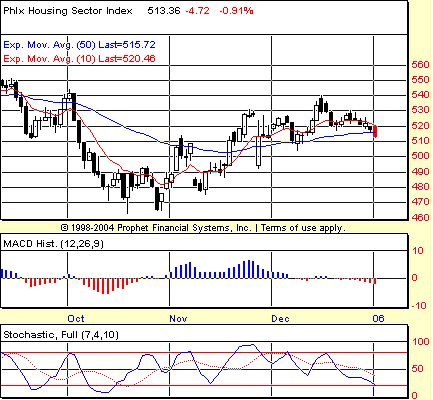
| FIGURE 2: PHILADELPHIA HOUSING SECTOR INDEX, MONTHLY. A month-to-month negative divergence in the stochastic is confirmed by a month-to-month negative divergence in the MACD histogram. |
| Graphic provided by: Prophet Financial, Inc. |
| |
| Does failing at 540 mean a return trip to the 460 level, as in the lows of October 2005? There is still quite a bit of distance between where the $HGX is now and where it might end up if buyers do not return to the sector. There are also a number of potential support levels -- such as the December lows at 505, the late November lows near 495 and the early November lows just south of 480 -- that could provide pause to any $HGX collapse. |
| But lower prices for the $HGX seem increasingly likely, given not only the resistance found at the 61.8% retracement level, but also the bearish patterns in the moving average convergence/divergence (MACD) histogram and stochastic. Note how prices form a higher peak in November vis-a-vis December while the corresponding MACD histogram and stochastic form lower peaks. Such a pattern in either of the two indicators would be reason enough for caution. Finding similar patterns in both only underscores the likelihood that those who are desperate for housing stocks will be able to purchase them at lower prices. |
Technical Writer for Technical Analysis of STOCKS & COMMODITIES magazine, Working-Money.com, and Traders.com Advantage.
| Title: | Technical Writer |
| Company: | Technical Analysis, Inc. |
| Address: | 4757 California Avenue SW |
| Seattle, WA 98116 | |
| Phone # for sales: | 206 938 0570 |
| Fax: | 206 938 1307 |
| Website: | www.Traders.com |
| E-mail address: | DPenn@traders.com |
Traders' Resource Links | |
| Charting the Stock Market: The Wyckoff Method -- Books | |
| Working-Money.com -- Online Trading Services | |
| Traders.com Advantage -- Online Trading Services | |
| Technical Analysis of Stocks & Commodities -- Publications and Newsletters | |
| Working Money, at Working-Money.com -- Publications and Newsletters | |
| Traders.com Advantage -- Publications and Newsletters | |
| Professional Traders Starter Kit -- Software | |
Click here for more information about our publications!
Comments
Date: 01/05/06Rank: 3Comment:

Request Information From Our Sponsors
- StockCharts.com, Inc.
- Candle Patterns
- Candlestick Charting Explained
- Intermarket Technical Analysis
- John Murphy on Chart Analysis
- John Murphy's Chart Pattern Recognition
- John Murphy's Market Message
- MurphyExplainsMarketAnalysis-Intermarket Analysis
- MurphyExplainsMarketAnalysis-Visual Analysis
- StockCharts.com
- Technical Analysis of the Financial Markets
- The Visual Investor
- VectorVest, Inc.
- Executive Premier Workshop
- One-Day Options Course
- OptionsPro
- Retirement Income Workshop
- Sure-Fire Trading Systems (VectorVest, Inc.)
- Trading as a Business Workshop
- VectorVest 7 EOD
- VectorVest 7 RealTime/IntraDay
- VectorVest AutoTester
- VectorVest Educational Services
- VectorVest OnLine
- VectorVest Options Analyzer
- VectorVest ProGraphics v6.0
- VectorVest ProTrader 7
- VectorVest RealTime Derby Tool
- VectorVest Simulator
- VectorVest Variator
- VectorVest Watchdog
