HOT TOPICS LIST
- MACD
- Fibonacci
- RSI
- Gann
- ADXR
- Stochastics
- Volume
- Triangles
- Futures
- Cycles
- Volatility
- ZIGZAG
- MESA
- Retracement
- Aroon
INDICATORS LIST
LIST OF TOPICS
PRINT THIS ARTICLE
by David Penn
Will the second time be the charm for copper bears?
Position: N/A
David Penn
Technical Writer for Technical Analysis of STOCKS & COMMODITIES magazine, Working-Money.com, and Traders.com Advantage.
PRINT THIS ARTICLE
FUTURES
Another Double Divergence In Copper
01/02/06 12:45:14 PMby David Penn
Will the second time be the charm for copper bears?
Position: N/A
| The last time copper futures created a double negative stochastic divergence on the daily continuous charts, the earth-shattering ka-boom to the downside I might have expected did not materialize. Instead, copper futures skid sideways for about a month -- more blown over than blown up. |

|
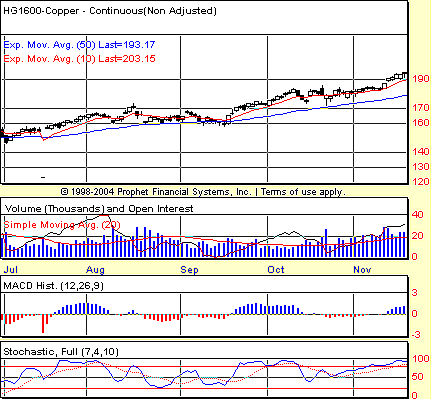
| FIGURE 1: COPPER PEAK. The peak in copper prices in August followed a negative divergence in the MACD histogram and a double negative divergence in the stochastic. |
| Graphic provided by: Prophet Financial, Inc. |
| |
| Negative divergences signal a loss of upside momentum. The consequences of that loss vary from outright reversals to sharp corrections to the sort of sideways action that occurred between mid-August and mid-September 2005 in copper futures (Figure 1). |
| The idea "that which does not kill us only makes us stronger" may be especially applicable to corrections in trends. Unless a trending market reverses, it will continue to trend and every correction will be far more likely opportunity than crisis. Trader, educator, and founder of Pristine.com, Oliver Velez Jr., has exhorted traders to pay close attention to this notion, insisting: "As a trader, your job in an uptrend is to buy every single decline. Not most of them. Not some of them. All of them." |

|
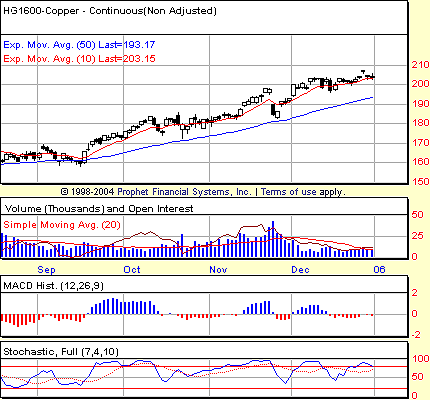
| FIGURE 2: DOUBLE NEGATIVE. A double negative divergence over the November-December period suggests softness in copper prices going forward. |
| Graphic provided by: Prophet Financial, Inc. |
| |
| The mid-August to mid-September correction served as an excellent accumulation region for those bulls looking for a shot at riding copper higher. Positive divergences in the moving average convergence/divergence (MACD) histogram and stochastic on September 19 created a great "go-ahead" signal, and an increase in volume accompanied the break to the upside. |
| Will the current double divergence in copper futures similarly result in milder copper prices in the first weeks of 2006 (Figure 2)? Copper futures already trended sideways over the course of December. This almost tempts me to believe that the product of the double negative divergence will also be a product of an expansion in volatility -- in other words, a downward correction of some significance. The $2.05 level (basis continuous futures) remains the region of resistance. In March futures, the equivalent level is about the same. Any inability to follow through movement above that level will likely encourage those ready to test copper's ability to move in the other direction. |
Technical Writer for Technical Analysis of STOCKS & COMMODITIES magazine, Working-Money.com, and Traders.com Advantage.
| Title: | Technical Writer |
| Company: | Technical Analysis, Inc. |
| Address: | 4757 California Avenue SW |
| Seattle, WA 98116 | |
| Phone # for sales: | 206 938 0570 |
| Fax: | 206 938 1307 |
| Website: | www.Traders.com |
| E-mail address: | DPenn@traders.com |
Traders' Resource Links | |
| Charting the Stock Market: The Wyckoff Method -- Books | |
| Working-Money.com -- Online Trading Services | |
| Traders.com Advantage -- Online Trading Services | |
| Technical Analysis of Stocks & Commodities -- Publications and Newsletters | |
| Working Money, at Working-Money.com -- Publications and Newsletters | |
| Traders.com Advantage -- Publications and Newsletters | |
| Professional Traders Starter Kit -- Software | |
Click here for more information about our publications!
Comments
Date: 01/05/06Rank: 2Comment:

Request Information From Our Sponsors
- StockCharts.com, Inc.
- Candle Patterns
- Candlestick Charting Explained
- Intermarket Technical Analysis
- John Murphy on Chart Analysis
- John Murphy's Chart Pattern Recognition
- John Murphy's Market Message
- MurphyExplainsMarketAnalysis-Intermarket Analysis
- MurphyExplainsMarketAnalysis-Visual Analysis
- StockCharts.com
- Technical Analysis of the Financial Markets
- The Visual Investor
- VectorVest, Inc.
- Executive Premier Workshop
- One-Day Options Course
- OptionsPro
- Retirement Income Workshop
- Sure-Fire Trading Systems (VectorVest, Inc.)
- Trading as a Business Workshop
- VectorVest 7 EOD
- VectorVest 7 RealTime/IntraDay
- VectorVest AutoTester
- VectorVest Educational Services
- VectorVest OnLine
- VectorVest Options Analyzer
- VectorVest ProGraphics v6.0
- VectorVest ProTrader 7
- VectorVest RealTime Derby Tool
- VectorVest Simulator
- VectorVest Variator
- VectorVest Watchdog
