HOT TOPICS LIST
- MACD
- Fibonacci
- RSI
- Gann
- ADXR
- Stochastics
- Volume
- Triangles
- Futures
- Cycles
- Volatility
- ZIGZAG
- MESA
- Retracement
- Aroon
INDICATORS LIST
LIST OF TOPICS
PRINT THIS ARTICLE
by Gary Grosschadl
Wal-Mart is famous for its rollback pricing, and its stock is also playing the same tune.
Position: Sell
Gary Grosschadl
Independent Canadian equities trader and technical analyst based in Peterborough
Ontario, Canada.
PRINT THIS ARTICLE
FIBONACCI
Wal-Mart Price Rollback
01/02/06 08:23:40 AMby Gary Grosschadl
Wal-Mart is famous for its rollback pricing, and its stock is also playing the same tune.
Position: Sell
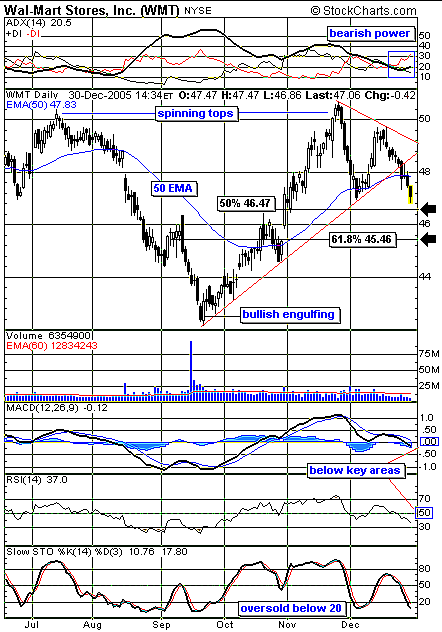
| Wal-Mart's daily chart (Figure 1) shows a triangle or trendline break that occurred several trading days ago. The nearby 50-day exponential moving average (EMA) held only brief support. Lower support targets were assessed using Fibonacci retracement levels. Based on the high and low of the chart, the next two support levels were indicated at 50% and 61.8% retracements. |
| Several indicators show their own bearishness. The directional movement components atop the chart show bearish power with a rising average directional movement index (ADX) between the two directional indicators. Bearish power is indicated with -DI above +DI. The lower indicators have the moving average convergence/divergence (MACD) and the relative strength index (RSI) below their often key areas of support. |

|
| FIGURE 1: WMT, DAILY. The daily chart of Wal-Mart shows two Fibonacci support levels. |
| Graphic provided by: StockCharts.com. |
| |
| Candlestick readers should note the bullish engulfing pattern at the bottom of the chart and the spinning tops at the chart highs. These indicators are often reliable turning points at market bottoms and tops. |
| Looking ahead, any uplegs may only be bear rallies if the overhead 50-period EMA provides stiff resistance, while fresh support above that same line would encourage new bulls into the market. |
Independent Canadian equities trader and technical analyst based in Peterborough
Ontario, Canada.
| Website: | www.whatsonsale.ca/financial.html |
| E-mail address: | gwg7@sympatico.ca |
Click here for more information about our publications!
Comments
Date: 01/05/06Rank: 5Comment:

Request Information From Our Sponsors
- StockCharts.com, Inc.
- Candle Patterns
- Candlestick Charting Explained
- Intermarket Technical Analysis
- John Murphy on Chart Analysis
- John Murphy's Chart Pattern Recognition
- John Murphy's Market Message
- MurphyExplainsMarketAnalysis-Intermarket Analysis
- MurphyExplainsMarketAnalysis-Visual Analysis
- StockCharts.com
- Technical Analysis of the Financial Markets
- The Visual Investor
- VectorVest, Inc.
- Executive Premier Workshop
- One-Day Options Course
- OptionsPro
- Retirement Income Workshop
- Sure-Fire Trading Systems (VectorVest, Inc.)
- Trading as a Business Workshop
- VectorVest 7 EOD
- VectorVest 7 RealTime/IntraDay
- VectorVest AutoTester
- VectorVest Educational Services
- VectorVest OnLine
- VectorVest Options Analyzer
- VectorVest ProGraphics v6.0
- VectorVest ProTrader 7
- VectorVest RealTime Derby Tool
- VectorVest Simulator
- VectorVest Variator
- VectorVest Watchdog
