HOT TOPICS LIST
- MACD
- Fibonacci
- RSI
- Gann
- ADXR
- Stochastics
- Volume
- Triangles
- Futures
- Cycles
- Volatility
- ZIGZAG
- MESA
- Retracement
- Aroon
INDICATORS LIST
LIST OF TOPICS
PRINT THIS ARTICLE
by Koos van der Merwe
In a rising oil price environment, are our roads becoming too expensive to maintain? What will the substance filling the potholes in the road consist of in the future?
Position: Sell
Koos van der Merwe
Has been a technical analyst since 1969, and has worked as a futures and options trader with First Financial Futures in Johannesburg, South Africa.
PRINT THIS ARTICLE
GANN
Astec A Profitable Road?
01/02/06 08:11:50 AMby Koos van der Merwe
In a rising oil price environment, are our roads becoming too expensive to maintain? What will the substance filling the potholes in the road consist of in the future?
Position: Sell
| Astec Industries Inc. (ASTE) designs, engineers, manufactures, markets, and finances equipment and components used primarily in road building and related construction activities. The company's products are used in each phase of road building, from quarrying and crushing the aggregate to application of the road surface. |

|
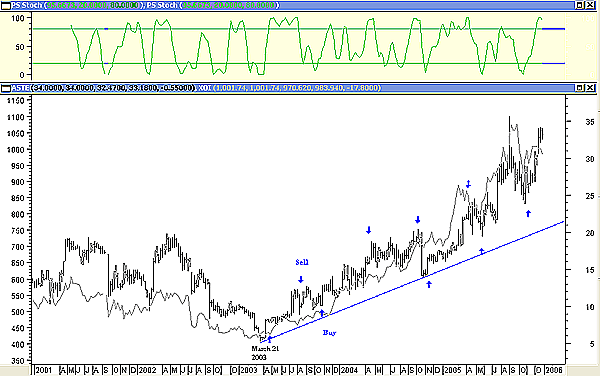
| FIGURE 1: ASTEC, WEEKLY, AND AMEX OIL AND GAS INDEX. See how ASTE echoes the Amex Oil and gas index (gray line). |
| Graphic provided by: MetaStock. |
| |
| In Figure 1, I have shown ASTE as a bar chart in black and the Amex Oil and Gas Index as a line chart in gray. The weekly chart shows how closely ASTE followed the Amex Oil and Gas index as it rose from March 2003, the start of the war in Iraq. You may ask, "But what has road building to do with the price of oil?" Remember, macadamized roads are made of crushed rocks held together with tar, and tar is an oil product. The Canadian Alberta tar sands, said to contain as much oil as Saudi Arabia, is a viable oil resource. The oil is extracted from the tar and the process has become a payable proposition with the high oil price of today. With the price of oil so high, and as my December 29th article "Is the oil and gas rise over?" shows, oil should reach a low early in 2006, and then start rising to new highs. ASTE is one company that could benefit. The ASTE chart will probably continue to follow the Amex Oil and Gas Index until asphalt becomes so pricey that roads will no longer be built from it. This is probably one of the reasons ASTE is a partner in a joint venture that makes testing and sampling equipment for the asphalt mix and aggregate processing industries. The indicator on the chart is the stochastic relative strength index (RSI), which is currently overbought and has not given a sell signal yet. |

|
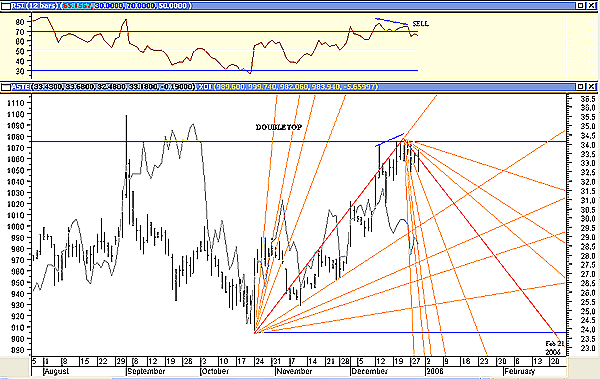
| FIGURE 2: ASTE, DAILY. Here's the daily chart of Astec and the Amex Oil and Gas Index. |
| Graphic provided by: MetaStock. |
| |
| Figure 2 is a daily chart and shows how on occasion the share price acts before the Amex Oil and Gas Index. Yet basically, the share price appears to follow the index. I have once again included a Gann fan, this one suggesting a low on February 21, 2006. The indicator on the chart is the RSI, which has given a sell signal, and a divergent one at that, where the price makes higher highs while the indicator makes lower highs. Divergence is a very accurate and powerful signal. My analysis suggests that ASTE is definitely a share to watch, and purchase when a buy signal is triggered. |
Has been a technical analyst since 1969, and has worked as a futures and options trader with First Financial Futures in Johannesburg, South Africa.
| Address: | 3256 West 24th Ave |
| Vancouver, BC | |
| Phone # for sales: | 6042634214 |
| E-mail address: | petroosp@gmail.com |
Click here for more information about our publications!
Comments
Date: 01/05/06Rank: 2Comment:

Request Information From Our Sponsors
- StockCharts.com, Inc.
- Candle Patterns
- Candlestick Charting Explained
- Intermarket Technical Analysis
- John Murphy on Chart Analysis
- John Murphy's Chart Pattern Recognition
- John Murphy's Market Message
- MurphyExplainsMarketAnalysis-Intermarket Analysis
- MurphyExplainsMarketAnalysis-Visual Analysis
- StockCharts.com
- Technical Analysis of the Financial Markets
- The Visual Investor
- VectorVest, Inc.
- Executive Premier Workshop
- One-Day Options Course
- OptionsPro
- Retirement Income Workshop
- Sure-Fire Trading Systems (VectorVest, Inc.)
- Trading as a Business Workshop
- VectorVest 7 EOD
- VectorVest 7 RealTime/IntraDay
- VectorVest AutoTester
- VectorVest Educational Services
- VectorVest OnLine
- VectorVest Options Analyzer
- VectorVest ProGraphics v6.0
- VectorVest ProTrader 7
- VectorVest RealTime Derby Tool
- VectorVest Simulator
- VectorVest Variator
- VectorVest Watchdog
