HOT TOPICS LIST
- MACD
- Fibonacci
- RSI
- Gann
- ADXR
- Stochastics
- Volume
- Triangles
- Futures
- Cycles
- Volatility
- ZIGZAG
- MESA
- Retracement
- Aroon
INDICATORS LIST
LIST OF TOPICS
PRINT THIS ARTICLE
by Paolo Pezzutti
The stock has printed a dark cloud cover pattern on the daily time frame.
Position: N/A
Paolo Pezzutti
Author of the book "Trading the US Markets - A Comprehensive Guide to US Markets for International Traders and Investors" - Harriman House (July 2008)
PRINT THIS ARTICLE
MACD
Qwest Prices Consolidate
01/02/06 08:32:06 AMby Paolo Pezzutti
The stock has printed a dark cloud cover pattern on the daily time frame.
Position: N/A
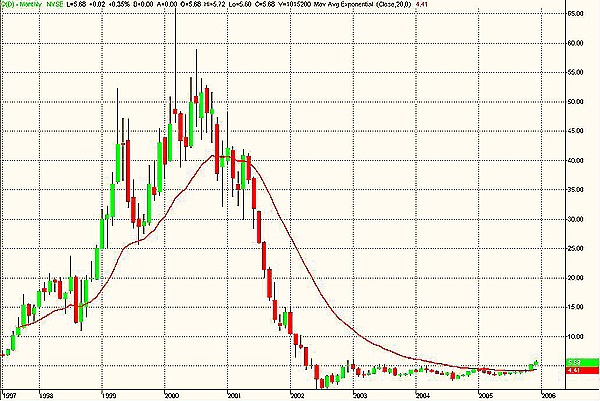
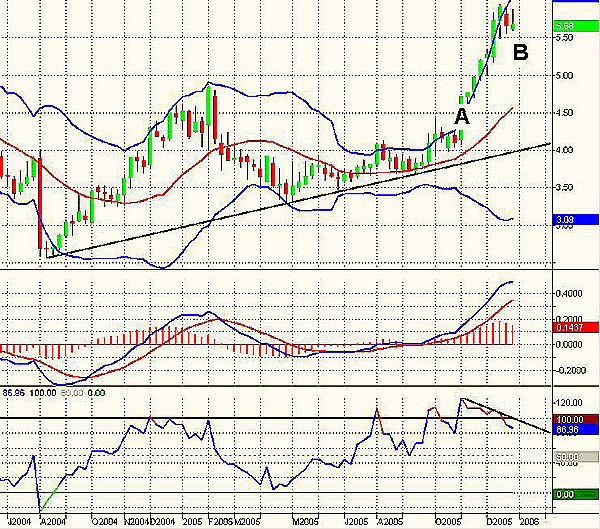
| From the 2000 top at $60, Qwest Communications (Q) reached a low of $1.07 in 2002. During the three years since then, the provider of telecommunications, data, and video services has had a respectable performance, moving up to the present $5.65 level (Figure 1). In the weekly time frame, in Figure 2, you can see that the stock printed a low at $2.56 in August 2004. Since then, the uptrend has brought prices to test the 2003 highs. The trend printed an acceleration during the last two months, when Qwest went up from the $4 level to the top at $5.95 printed in December 2005. The moving average convergence/divergence (MACD) histogram has turned down during the past two weeks. The Bollinger %b(close) indicator is printing a negative divergence. The uptrend acceleration has been impressive. Prices are now very far from their moving average. From the Bollinger Bands, you can tell that an impulse to the upside has been printed. However, the last week's bar did not manage to tag the upper Bollinger Band. In addition, the lower band has turned up. A consolidation from these levels is the most likely development. |

|
| FIGURE 1: QWEST, MONTHLY. The monthly Q chart displays how prices are distant from the 2000 highs. |
| Graphic provided by: TradeStation. |
| |
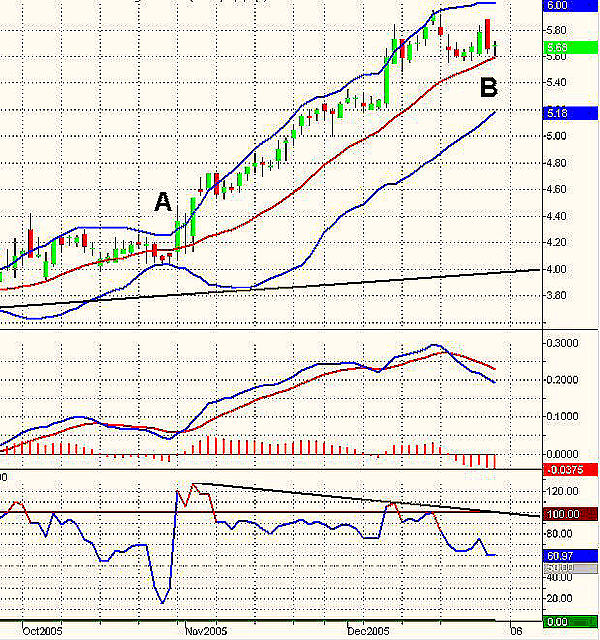
| The daily time frame, in Figure 3, shows a similar picture. The long sideways movement that occurred in October brought the volatility to extremely low levels (point A). You can see, in fact, how close the Bollinger Bands converged. Prices, then, exploded to the upside. The top of December 16 was marked in coincidence with a negative divergence of the %b (close) indicator. The MACD also has turned down. More interestingly, a candlestick dark cloud cover was printed on December 27-28 (point B). This two-candlestick pattern is a top reversal that occurs after an uptrend or at the top of a congestion area. The first day is a strong white real body. The second day's price opens above the prior session's high. By the end of the session, the market closes near the low and well within the prior day's white body. The rationale behind the pattern is clear. The market is in a trend phase. A white candlestick is followed by a gap higher at the open. Bulls are in control. But by the end of the day, the situation is completely different! The December 28th bar represents a significant resistance to resume the uptrend. |

|
| FIGURE 2: QWEST, WEEKLY. In the weekly time frame, the indicators suggest that a medium-term top has been printed. |
| Graphic provided by: TradeStation. |
| |
| In this situation, the stock should move to find a valid support to try and test recent highs again. I would not enter a long position in this phase. I'd rather wait and see how the consolidation develops in the short and medium term to spot either a lower-entry point or to trade the breakout of the dark cloud cover pattern. |

|
| FIGURE 3: QWEST, DAILY. The daily chart shows that consolidation from these levels is likely. |
| Graphic provided by: TradeStation. |
| |
Author of the book "Trading the US Markets - A Comprehensive Guide to US Markets for International Traders and Investors" - Harriman House (July 2008)
| Address: | VIA ROBERTO AGO 26 POSTAL CODE 00166 |
| Rome, ITALY | |
| Phone # for sales: | +393357540708 |
| E-mail address: | pezzutti.paolo@tiscali.it |
Click here for more information about our publications!
Comments
Date: 01/05/06Rank: 3Comment:

|

Request Information From Our Sponsors
- VectorVest, Inc.
- Executive Premier Workshop
- One-Day Options Course
- OptionsPro
- Retirement Income Workshop
- Sure-Fire Trading Systems (VectorVest, Inc.)
- Trading as a Business Workshop
- VectorVest 7 EOD
- VectorVest 7 RealTime/IntraDay
- VectorVest AutoTester
- VectorVest Educational Services
- VectorVest OnLine
- VectorVest Options Analyzer
- VectorVest ProGraphics v6.0
- VectorVest ProTrader 7
- VectorVest RealTime Derby Tool
- VectorVest Simulator
- VectorVest Variator
- VectorVest Watchdog
- StockCharts.com, Inc.
- Candle Patterns
- Candlestick Charting Explained
- Intermarket Technical Analysis
- John Murphy on Chart Analysis
- John Murphy's Chart Pattern Recognition
- John Murphy's Market Message
- MurphyExplainsMarketAnalysis-Intermarket Analysis
- MurphyExplainsMarketAnalysis-Visual Analysis
- StockCharts.com
- Technical Analysis of the Financial Markets
- The Visual Investor
