HOT TOPICS LIST
- MACD
- Fibonacci
- RSI
- Gann
- ADXR
- Stochastics
- Volume
- Triangles
- Futures
- Cycles
- Volatility
- ZIGZAG
- MESA
- Retracement
- Aroon
INDICATORS LIST
LIST OF TOPICS
PRINT THIS ARTICLE
by Koos van der Merwe
Is the rise over? For the moment, yes.
Position: Sell
Koos van der Merwe
Has been a technical analyst since 1969, and has worked as a futures and options trader with First Financial Futures in Johannesburg, South Africa.
PRINT THIS ARTICLE
ELLIOTT WAVE
Is The Oil And Gas Rise Over?
12/29/05 11:11:24 AMby Koos van der Merwe
Is the rise over? For the moment, yes.
Position: Sell
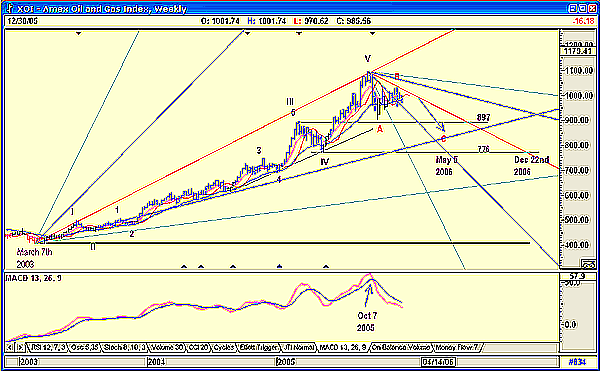
| Figure 1 is a weekly chart of the Amex Oil and Gas Index. I have prepared an Elliott wave count from March 7, 2003, to the week ended December 30, 2005. The wave count meets the first rule of Elliott -- namely, the count must look correct. The chart shows how the index moved up steadily as the oil price increased. Remarkably, the beginning of the recent rise in the index correlates closely with the start of the war in Iraq; in fact, the low was 12 days before the start of the war. |
| Bush Announces Start Of Iraq War: March 19, 2003 US President George W. Bush addressed the nation on television at 10.15 pm Eastern time (2.15 pm March 20, AEST). His speech begins: My fellow citizens, at this hour American and coalition forces are in the early stages of military operations to disarm Iraq, to free its people and to defend the world from grave danger. So forth and so on. The full context of his speech is available ad nauseam elsewhere on the web. What is surprising is that critics of the war suggest that the reason for the invasion was to take control of Iraq's oil wells, which means that the price of oil should have dropped, not escalated the way the chart shows. However, as a chartist, it is not for me to interpret politics or look for the reasons why. It is simply for me to follow my charts (do or die). |
| The index shown by the chart is suggesting that that the price of oil should weaken by a further 8% to 20%. This is because the wave count is suggesting a fall to the area of the fourth wave of lesser degree, namely somewhere between the 776 and 897 levels. This weakness is confirmed by the moving average convergence/divergence (MACD) indicator, which gave a sell signal on October 7, 2005. |

|
| FIGURE 1: AMEX OIL AND GAS INDEX, WEEKLY. Here, the index can be seen with the wave count and Gann fans. |
| Graphic provided by: AdvancedGET. |
| |
| Finally, note how the Gann fan at a scale of 5 (I am a traditionalist and prefer using WD Gann's original numbers of 1 - 2 - 5, and so on) perfectly forecast the top of wave V. This allows me to call a possible turning point for the index -- that is, the completion of wave V, on May 5, 2006, five months hence, or December 22, 2006. These dates are determined by charting a Gann fan from the high of wave V. Where the 2x1 or 1x1 of the fan crosses a horizontal drawn from the low of wave IV is the suggested turning point and completion of a wave C. Wave C usually corrects in five impulse waves, but an a-b-c correction is possible. If it is the former, then I anticipate the December date as the more feasible. To conclude, my chart is suggesting that the Amex Oil and Gas Index should continue falling until May 5, 2006, or at the outside, December 2006. The suggested target for the end of wave 4 is between 776 and 897. |
Has been a technical analyst since 1969, and has worked as a futures and options trader with First Financial Futures in Johannesburg, South Africa.
| Address: | 3256 West 24th Ave |
| Vancouver, BC | |
| Phone # for sales: | 6042634214 |
| E-mail address: | petroosp@gmail.com |
Click here for more information about our publications!
Comments
Date: 12/30/05Rank: 2Comment:
Date: 01/02/06Rank: 3Comment:

Request Information From Our Sponsors
- StockCharts.com, Inc.
- Candle Patterns
- Candlestick Charting Explained
- Intermarket Technical Analysis
- John Murphy on Chart Analysis
- John Murphy's Chart Pattern Recognition
- John Murphy's Market Message
- MurphyExplainsMarketAnalysis-Intermarket Analysis
- MurphyExplainsMarketAnalysis-Visual Analysis
- StockCharts.com
- Technical Analysis of the Financial Markets
- The Visual Investor
- VectorVest, Inc.
- Executive Premier Workshop
- One-Day Options Course
- OptionsPro
- Retirement Income Workshop
- Sure-Fire Trading Systems (VectorVest, Inc.)
- Trading as a Business Workshop
- VectorVest 7 EOD
- VectorVest 7 RealTime/IntraDay
- VectorVest AutoTester
- VectorVest Educational Services
- VectorVest OnLine
- VectorVest Options Analyzer
- VectorVest ProGraphics v6.0
- VectorVest ProTrader 7
- VectorVest RealTime Derby Tool
- VectorVest Simulator
- VectorVest Variator
- VectorVest Watchdog
