HOT TOPICS LIST
- MACD
- Fibonacci
- RSI
- Gann
- ADXR
- Stochastics
- Volume
- Triangles
- Futures
- Cycles
- Volatility
- ZIGZAG
- MESA
- Retracement
- Aroon
INDICATORS LIST
LIST OF TOPICS
PRINT THIS ARTICLE
by Gary Grosschadl
With gold prices reaching more than 20-year highs, it is easier to determine possible upside targets from gold index charts as they are below their 10-year highs.
Position: Hold
Gary Grosschadl
Independent Canadian equities trader and technical analyst based in Peterborough
Ontario, Canada.
PRINT THIS ARTICLE
ANDREWS PITCH-FORK
This Gold Index Shows More Upside
12/29/05 08:41:57 AMby Gary Grosschadl
With gold prices reaching more than 20-year highs, it is easier to determine possible upside targets from gold index charts as they are below their 10-year highs.
Position: Hold
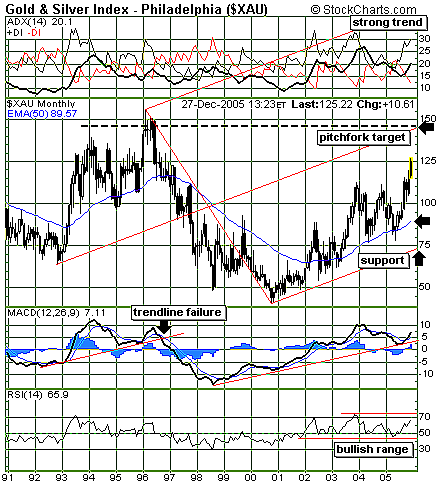
| Figure 1, a long-term monthly chart of the Philadelphia Gold & Silver Index (XAU), shows an upward bias via a bullish-pointing Andrews line or pitchfork. This method of showing support and resistance is anchored by three major turning points that determine how parallel lines are plotted. These lines are then viewed as potential support and resistance areas. |
| Pitchfork theory involves an eventual bullish move to the center median line, where a reversal often ensues. A superbullish move can also reach the upper median line, as this is a much rarer occasion. Traders may target a move to the center median line as a profit-taking point. The bigger picture indicates that as long as the lower pitchfork line holds support, the uptrend is intact. |

|
| FIGURE 1: $XAU, MONTHLY. This monthly view of the popular gold index shows a pitchfork target. |
| Graphic provided by: StockCharts.com. |
| |
| The pitchfork target also relates to the previous highs of 1994 and 1996. That makes this area prone to likely formidable resistance. Should a downleg occur, two areas of support are indicated. The 50-period moving average may offer support (currently 89.57), and stronger support would likely be offered at the lower pitchfork median line, currently near 75. |
| Several indicators are worthy of comment. At the top of the chart, the directional movement indicator shows a very bullish setup. The average directional movement index line (ADX) has a strong upslope heading above 20, while the directional indexes are bullishly poised, with the positive directional indicator above its negative power counterpart. A similar strong trend is shown via the moving average convergence/divergence indicator (MACD) with its bullish turn above zero. Note the previous serious downleg after this graph's trendline was violated. This may again provide a timely exit signal. The relative strength index (RSI) shows a bullish trading range. A move outside this range could point to a significant development. |
| This analysis shows a more plausible upside target rather than trying to decipher the gold price chart. With the gold price striking $540 in recent days, the previous high-water mark of $840 (in the early 1980s) seems too unlikely a future target. Traders may be better served taking their cues from the gold & silver index. |
Independent Canadian equities trader and technical analyst based in Peterborough
Ontario, Canada.
| Website: | www.whatsonsale.ca/financial.html |
| E-mail address: | gwg7@sympatico.ca |
Click here for more information about our publications!
Comments
Date: 12/30/05Rank: 5Comment:

Request Information From Our Sponsors
- StockCharts.com, Inc.
- Candle Patterns
- Candlestick Charting Explained
- Intermarket Technical Analysis
- John Murphy on Chart Analysis
- John Murphy's Chart Pattern Recognition
- John Murphy's Market Message
- MurphyExplainsMarketAnalysis-Intermarket Analysis
- MurphyExplainsMarketAnalysis-Visual Analysis
- StockCharts.com
- Technical Analysis of the Financial Markets
- The Visual Investor
- VectorVest, Inc.
- Executive Premier Workshop
- One-Day Options Course
- OptionsPro
- Retirement Income Workshop
- Sure-Fire Trading Systems (VectorVest, Inc.)
- Trading as a Business Workshop
- VectorVest 7 EOD
- VectorVest 7 RealTime/IntraDay
- VectorVest AutoTester
- VectorVest Educational Services
- VectorVest OnLine
- VectorVest Options Analyzer
- VectorVest ProGraphics v6.0
- VectorVest ProTrader 7
- VectorVest RealTime Derby Tool
- VectorVest Simulator
- VectorVest Variator
- VectorVest Watchdog
