HOT TOPICS LIST
- MACD
- Fibonacci
- RSI
- Gann
- ADXR
- Stochastics
- Volume
- Triangles
- Futures
- Cycles
- Volatility
- ZIGZAG
- MESA
- Retracement
- Aroon
INDICATORS LIST
LIST OF TOPICS
PRINT THIS ARTICLE
by Paolo Pezzutti
Johnson & Johnson is printing multiple MACD positive divergences.
Position: Accumulate
Paolo Pezzutti
Author of the book "Trading the US Markets - A Comprehensive Guide to US Markets for International Traders and Investors" - Harriman House (July 2008)
PRINT THIS ARTICLE
MACD
Johnson & Johnson: Close To Medium-Term Supports
12/28/05 10:52:29 AMby Paolo Pezzutti
Johnson & Johnson is printing multiple MACD positive divergences.
Position: Accumulate
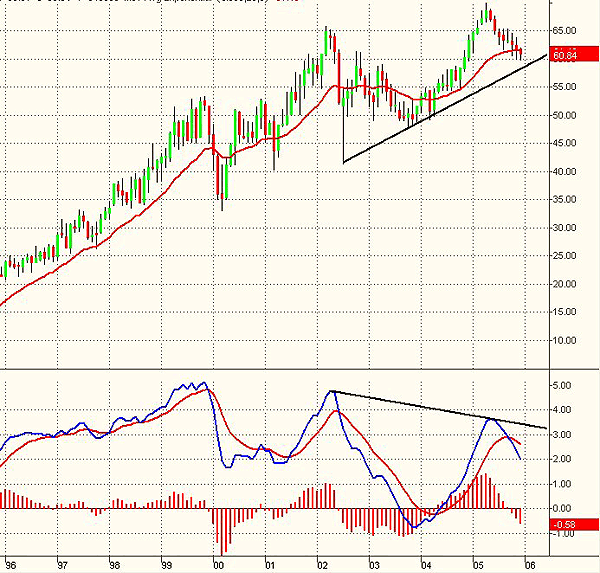
| During the past decade, Johnson & Johnson (JNJ) moved up from the $20 level to the present $60. The stock managed to maintain the uptrend even during the market's difficult times between 2000 and 2002. In Figure 1, the monthly chart displays the stock's respectable performance. The recent top printed in April 2005 occurred with a negative divergence of moving average convergence/divergence (MACD). As a remainder, the indicator calculates two exponential moving averages (EMAs). The difference between these two averages is plotted as the MACD (blue line). This value is averaged and then plotted as the MACDAvg (red line). The difference between MACD and MACD average is plotted as the MACDDiff (red histogram). In the chart, you can see that the MACD has turned down and crossed its moving average. Prices have pulled back to the moving average. |

|
| FIGURE 1: JNJ, MONTHLY. The MACD printed a negative divergence in coincidence with the recent highs. |
| Graphic provided by: TradeStation. |
| |
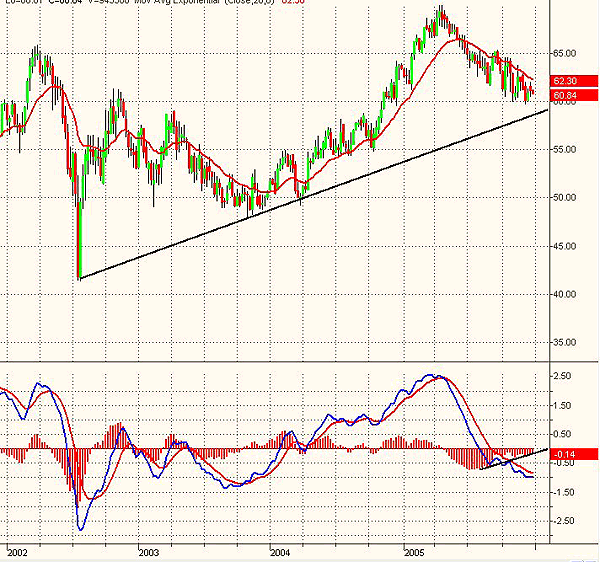
| In Figure 2, the weekly chart displays the long correction that started in April 2005. Prices are now getting closer to the trendline that supports the uptrend that started in 2002. Note that the MacDiff red histogram has been printing a positive divergence during the past few months. |

|
| FIGURE 2: JNJ, WEEKLY. Prices are close to medium-term supports on the weekly time frame. |
| Graphic provided by: TradeStation. |
| |
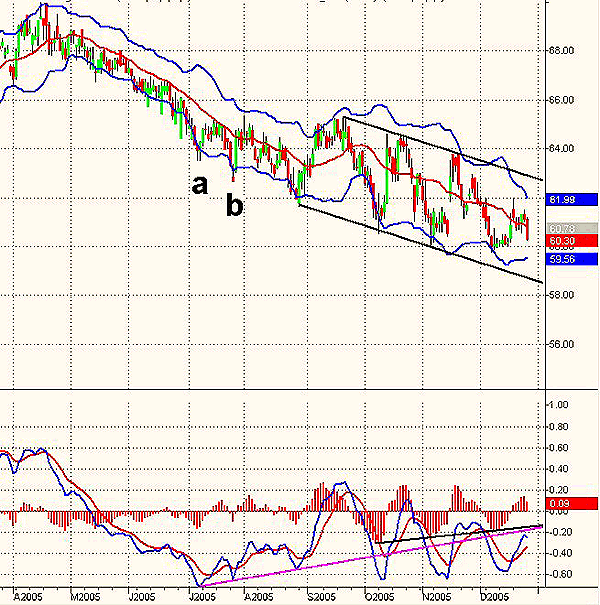
| At the daily level, in Figure 3, the correction that started last April shows two distinct characteristics. A first phase saw prices decline in a smooth and directional downtrend within a narrow negatively inclined channel. A second phase, initiated in August, displayed an increase in volatility, but less directionality. This environment has been difficult for traders. In points A and B, the MACD printed two consecutive positive divergences. Finally, after point B, in August 2005, prices managed to interrupt the downtrend and recover from the $61 level to the $65. The downtrend resumed soon, only to see prices print new lows in a volatile environment. In October, November, and December, JNJ tested the previous lows, managing to reenter the previous trading range. During this action, the MacDiff red histogram printed positive divergences. |

|
| FIGURE 3: JNJ, DAILY. MACD multiple positive divergences mark the long correction at the daily level. |
| Graphic provided by: TradeStation. |
| |
| In the long- and medium-term, JNJ is in an uptrend. Prices are now printing a long correction. They are approaching important supports. At the daily level, you can see a very interesting ongoing price action. Multiple positive divergences of MACD bring the stock to new lows. I would try to spot a short-term reversal formation to enter a long position with limited risk, as there is upside potential in these conditions. |
Author of the book "Trading the US Markets - A Comprehensive Guide to US Markets for International Traders and Investors" - Harriman House (July 2008)
| Address: | VIA ROBERTO AGO 26 POSTAL CODE 00166 |
| Rome, ITALY | |
| Phone # for sales: | +393357540708 |
| E-mail address: | pezzutti.paolo@tiscali.it |
Click here for more information about our publications!
Comments
Date: 12/30/05Rank: 3Comment:

|

Request Information From Our Sponsors
- StockCharts.com, Inc.
- Candle Patterns
- Candlestick Charting Explained
- Intermarket Technical Analysis
- John Murphy on Chart Analysis
- John Murphy's Chart Pattern Recognition
- John Murphy's Market Message
- MurphyExplainsMarketAnalysis-Intermarket Analysis
- MurphyExplainsMarketAnalysis-Visual Analysis
- StockCharts.com
- Technical Analysis of the Financial Markets
- The Visual Investor
- VectorVest, Inc.
- Executive Premier Workshop
- One-Day Options Course
- OptionsPro
- Retirement Income Workshop
- Sure-Fire Trading Systems (VectorVest, Inc.)
- Trading as a Business Workshop
- VectorVest 7 EOD
- VectorVest 7 RealTime/IntraDay
- VectorVest AutoTester
- VectorVest Educational Services
- VectorVest OnLine
- VectorVest Options Analyzer
- VectorVest ProGraphics v6.0
- VectorVest ProTrader 7
- VectorVest RealTime Derby Tool
- VectorVest Simulator
- VectorVest Variator
- VectorVest Watchdog
